How To Install ELK Stack on AlmaLinux 9

In today’s data-driven world, the ability to efficiently collect, process, and analyze large volumes of data is crucial for businesses and organizations. The ELK Stack, comprising Elasticsearch, Logstash, and Kibana, has emerged as a powerful solution for log management, data visualization, and real-time analytics. This guide will walk you through the process of installing the ELK Stack on AlmaLinux 9, a robust and enterprise-ready Linux distribution.
Understanding the ELK Stack
Before diving into the installation process, let’s briefly explore the components of the ELK Stack:
- Elasticsearch: A distributed, RESTful search and analytics engine capable of addressing a growing number of use cases.
- Logstash: A server-side data processing pipeline that ingests data from multiple sources simultaneously, transforms it, and then sends it to a “stash” like Elasticsearch.
- Kibana: A web interface for searching, viewing, and interacting with data stored in Elasticsearch indices.
The ELK Stack offers numerous benefits, including centralized logging, real-time data analysis, scalability, and customizable visualizations. These features make it an invaluable tool for system administrators, developers, and data analysts alike.
Prerequisites
Before proceeding with the installation, ensure that your system meets the following requirements:
- AlmaLinux 9 installed and updated
- Minimum 4GB RAM (8GB or more recommended for production environments)
- At least 10GB of free disk space
- Root or sudo access to the server
- A stable internet connection
Preparing AlmaLinux 9
Start by updating your AlmaLinux 9 system and installing necessary dependencies:
sudo dnf update -y
sudo dnf install -y wget curl java-11-openjdk-devel
Next, configure the firewall to allow traffic on the required ports:
sudo firewall-cmd --permanent --add-port=9200/tcp
sudo firewall-cmd --permanent --add-port=5601/tcp
sudo firewall-cmd --reload
Installing Elasticsearch
To install Elasticsearch, follow these steps:
1. Add the Elasticsearch repository
sudo rpm --import https://artifacts.elastic.co/GPG-KEY-elasticsearch

sudo tee /etc/yum.repos.d/elasticsearch.repo << EOF
[elasticsearch]
name=Elasticsearch repository for 8.x packages
baseurl=https://artifacts.elastic.co/packages/8.x/yum
gpgcheck=1
gpgkey=https://artifacts.elastic.co/GPG-KEY-elasticsearch
enabled=1
autorefresh=1
type=rpm-md
EOF
2. Install Elasticsearch
sudo dnf install elasticsearch -y3. Configure Elasticsearch
Edit the Elasticsearch configuration file:
sudo nano /etc/elasticsearch/elasticsearch.ymlModify the following lines:
network.host: 0.0.0.0
discovery.type: single-node
4. Start and enable Elasticsearch service
sudo systemctl start elasticsearch
sudo systemctl enable elasticsearch
5. Verify Elasticsearch installation
curl -X GET "localhost:9200/"If the installation is successful, you should see a JSON response with Elasticsearch version information.
Installing Logstash
Follow these steps to install Logstash:
1. Add the Logstash repository
sudo tee /etc/yum.repos.d/logstash.repo << EOF
[logstash-8.x]
name=Elastic repository for 8.x packages
baseurl=https://artifacts.elastic.co/packages/8.x/yum
gpgcheck=1
gpgkey=https://artifacts.elastic.co/GPG-KEY-elasticsearch
enabled=1
autorefresh=1
type=rpm-md
EOF
2. Install Logstash
sudo dnf install logstash -y3. Configure Logstash
Create a basic Logstash pipeline configuration:
sudo nano /etc/logstash/conf.d/01-logstash-simple.confAdd the following content:
input {
  beats {
    port => 5044
  }
}

output {
  elasticsearch {
    hosts => ["localhost:9200"]
    index => "%{[@metadata][beat]}-%{[@metadata][version]}-%{+YYYY.MM.dd}"
  }
}
4. Start and enable Logstash service
sudo systemctl start logstash
sudo systemctl enable logstash
Installing Kibana
To install Kibana, follow these steps:
1. Add the Kibana repository
sudo tee /etc/yum.repos.d/kibana.repo << EOF
[kibana-8.x]
name=Kibana repository for 8.x packages
baseurl=https://artifacts.elastic.co/packages/8.x/yum
gpgcheck=1
gpgkey=https://artifacts.elastic.co/GPG-KEY-elasticsearch
enabled=1
autorefresh=1
type=rpm-md
EOF
2. Install Kibana
sudo dnf install kibana -y3. Configure Kibana
Edit the Kibana configuration file:
sudo nano /etc/kibana/kibana.ymlModify the following lines:
server.host: "0.0.0.0"
elasticsearch.hosts: ["http://localhost:9200"]
4. Start and enable Kibana service
sudo systemctl start kibana
sudo systemctl enable kibana
5. Access Kibana web interface
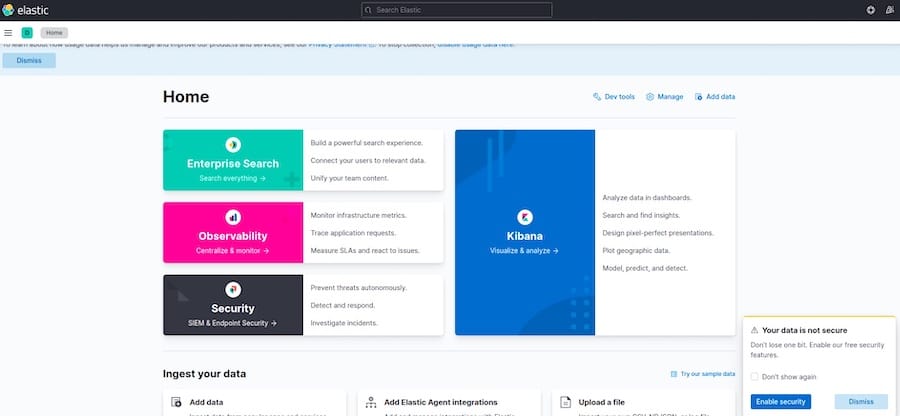
Open a web browser and navigate to http://your_server_ip:5601. You should see the Kibana login page.

Configuring ELK Stack
Now that you have installed all components of the ELK Stack, it’s time to configure them to work together effectively:
1. Set up index patterns in Kibana
- Log in to Kibana web interface
- Go to “Stack Management” > “Index Patterns”
- Click “Create index pattern”
- Enter the index pattern (e.g., “logstash-*”)
- Select “@timestamp” as the Time field
- Click “Create index pattern”
2. Create visualizations and dashboards
- Go to “Visualize” in Kibana
- Click “Create visualization”
- Choose a visualization type (e.g., bar chart, pie chart)
- Select the index pattern you created
- Configure the visualization settings
- Save the visualization
- Repeat the process to create multiple visualizations
- Go to “Dashboard” and create a new dashboard
- Add your saved visualizations to the dashboard
3. Configure Logstash input and output plugins
Modify the Logstash configuration file to add specific input and output plugins based on your data sources and requirements. For example, to collect system logs:
input {
  file {
    path => "/var/log/syslog"
    type => "syslog"
  }
}

filter {
  if [type] == "syslog" {
    grok {
      match => { "message" => "%{SYSLOGTIMESTAMP:syslog_timestamp} %{SYSLOGHOST:syslog_hostname} %{DATA:syslog_program}(?:\[%{POSINT:syslog_pid}\])?: %{GREEDYDATA:syslog_message}" }
    }
    date {
      match => [ "syslog_timestamp", "MMM  d HH:mm:ss", "MMM dd HH:mm:ss" ]
    }
  }
}

output {
  elasticsearch {
    hosts => ["localhost:9200"]
    index => "syslog-%{+YYYY.MM.dd}"
  }
}
Securing ELK Stack
To ensure the security of your ELK Stack installation, consider implementing the following measures:
1. Enable authentication and encryption
Edit the Elasticsearch configuration file to enable X-Pack security:
sudo nano /etc/elasticsearch/elasticsearch.ymlAdd the following lines:
xpack.security.enabled: true
xpack.security.transport.ssl.enabled: true
2. Configure SSL/TLS
Generate SSL certificates for Elasticsearch and configure Kibana to use HTTPS:
sudo /usr/share/elasticsearch/bin/elasticsearch-certutil cert -out /etc/elasticsearch/elastic-certificates.p12 -pass ""
sudo chown elasticsearch:elasticsearch /etc/elasticsearch/elastic-certificates.p12
Update the Elasticsearch configuration:
xpack.security.transport.ssl.keystore.path: /etc/elasticsearch/elastic-certificates.p12
xpack.security.transport.ssl.truststore.path: /etc/elasticsearch/elastic-certificates.p12
3. Implement role-based access control
Use the Kibana web interface to create users and assign roles based on their responsibilities and access requirements.
Troubleshooting Common Issues
When setting up the ELK Stack, you may encounter some common issues:
- Connection problems: Ensure that firewall rules are correctly configured and that services are running on the specified ports.
- Configuration errors: Double-check configuration files for syntax errors or misconfigurations.
- Performance issues: Monitor system resources and adjust Elasticsearch heap size or Logstash worker settings as needed.
Congratulations! You have successfully installed ELK Stack. Thanks for using this tutorial for installing the ELK Stack on your AlmaLinux 9 system. For additional help or useful information, we recommend you check the official ELK Stack website.