How To Install ELK Stack on Debian 12

The ELK Stack, comprising Elasticsearch, Logstash, and Kibana, is a powerful combination of tools for data analysis and visualization. Elasticsearch is a distributed search and analytics engine, Logstash is a data processing pipeline, and Kibana is a visualization platform. Together, they enable users to collect, process, and visualize data from various sources, making it an essential tool for log management, system monitoring, and business intelligence. In this comprehensive guide, we will walk you through the step-by-step process of installing the ELK Stack on Debian 12, ensuring that you have a robust and efficient setup for your data analysis needs.
Prerequisites
Before diving into the installation process, ensure that your system meets the following requirements:
System Requirements
To run the ELK Stack smoothly, your Debian 12 server should have at least:
- 4GB of RAM
- 2 CPU cores
- 20GB of free disk space
Software Requirements
- Debian 12 installed on your server
- Root or sudo access to execute commands
Step 1: Update System Packages
Before installing the ELK Stack components, it’s crucial to update your system packages to ensure compatibility and security. Run the following command to update and upgrade your packages:
sudo apt update && sudo apt upgrade -yStep 2: Install Java
The ELK Stack requires Java to function properly. Elasticsearch and Logstash are built on top of Java, making it a fundamental dependency. To install the latest version of OpenJDK, execute the following command:
sudo apt install openjdk-17-jdk -yAfter the installation is complete, verify the Java version by running:
java -versionStep 3: Add Elastic Stack Repositories
To install the ELK Stack components using apt, you need to add the official Elastic Stack repositories to your system. First, import the GPG key to ensure the authenticity of the packages:
curl -fsSL https://artifacts.elastic.co/GPG-KEY-elasticsearch | sudo gpg --dearmor -o /etc/apt/trusted.gpg.d/elastic.gpgNext, add the repository source list by executing:
echo "deb https://artifacts.elastic.co/packages/8.x/apt stable main" | sudo tee /etc/apt/sources.list.d/elastic-8.x.listFinally, update the package index to include the newly added repositories:
sudo apt updateStep 4: Install Elasticsearch
With the repositories set up, you can now install Elasticsearch using the following command:
sudo apt install elasticsearch -yOnce the installation is complete, you need to modify the Elasticsearch configuration file located at /etc/elasticsearch/elasticsearch.yml. Open the file with your preferred text editor, such as nano or vim, and make the following changes:
- Set
network.hostto"0.0.0.0"to allow remote access - Set
cluster.nameto a unique name for your Elasticsearch cluster - Adjust other settings as per your requirements
After saving the configuration file, start and enable the Elasticsearch service using the following commands:
sudo systemctl start elasticsearch
sudo systemctl enable elasticsearch
Step 5: Install Logstash
Logstash is the data processing pipeline in the ELK Stack. To install Logstash, run:
sudo apt install logstashAfter installation, you need to configure the Logstash pipeline. Create a new configuration file in the /etc/logstash/conf.d/ directory, specifying the input, filter, and output settings according to your data sources and requirements.
Once the configuration is set, start and enable the Logstash service:
sudo systemctl start logstash
sudo systemctl enable logstash
Step 6: Install Kibana
Kibana is the web-based visualization platform for the ELK Stack. Install Kibana using the following command:
sudo apt install kibanaAfter installation, edit the Kibana configuration file located at /etc/kibana/kibana.yml. Make the following changes:
- Set
server.hostto"0.0.0.0"to allow remote access - Adjust other settings as needed
Save the configuration file and start and enable the Kibana service:
sudo systemctl start kibana
sudo systemctl enable kibana
Step 7: Install Beats
Beats are lightweight data shippers that send data from various sources to Logstash or Elasticsearch. There are several Beats modules available, such as Filebeat for log files, Metricbeat for system metrics, and more. As an example, let’s install Filebeat:
sudo apt install filebeatAfter installation, configure Filebeat by editing the configuration file at /etc/filebeat/filebeat.yml. Specify the log file paths to monitor and the output destination (Logstash or Elasticsearch).
Once configured, start and enable the Filebeat service:
sudo systemctl start filebeat
sudo systemctl enable filebeat
Testing the Installation
To ensure that your ELK Stack installation is functioning correctly, perform the following tests:
Testing Elasticsearch
Use the curl command to check the status of your Elasticsearch instance:
curl -X GET "localhost:9200/_cat/nodes?v&pretty"If Elasticsearch is running correctly, you should see a response with information about the nodes in your cluster.
Testing Kibana Access
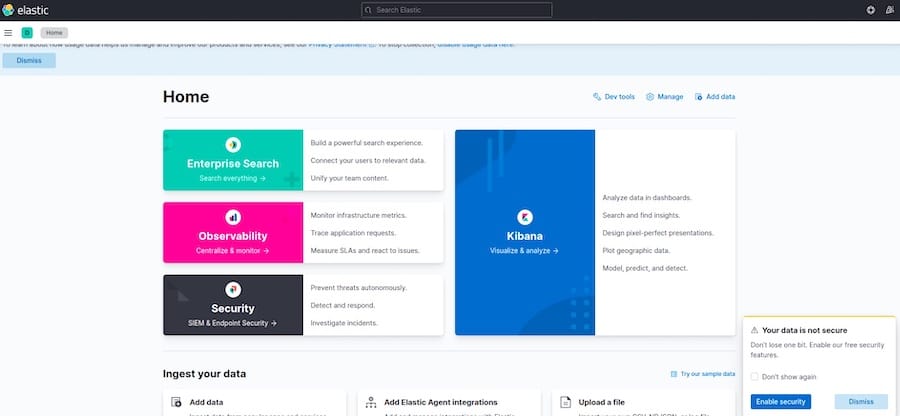
Open a web browser and navigate to http://<your-server-ip>:5601. If Kibana is set up correctly, you should see the Kibana web interface.

Troubleshooting Common Issues
If you encounter any issues during the installation or while using the ELK Stack, consider the following troubleshooting tips:
- Installation Errors: Double-check that you have followed all the steps correctly and have the necessary permissions. Ensure that you have added the correct repositories and have an active internet connection.
- Service Start Failures: Check the log files for each component to identify the cause of the failure. Common issues include incorrect configurations, insufficient resources, or port conflicts.
Congratulations! You have successfully installed ELK Stack. Thanks for using this tutorial for installing the ELK Stack on your Debian 12 system. For additional help or useful information, we recommend you check the official ELK Stack website.