In this tutorial, we will show you how to install ELK Stack on Fedora 39. The ELK Stack is a powerful collection of three open-source tools — Elasticsearch, Logstash, and Kibana — that together enable users to search, analyze, and visualize real-time data. Elasticsearch is a search and analytics engine, Logstash is a server‑side data processing pipeline, and Kibana lets users visualize data with charts and graphs. For system administrators, developers, and DevOps professionals, the ELK Stack is an invaluable suite for managing logs and understanding complex data systems.
This article assumes you have at least basic knowledge of Linux, know how to use the shell, and most importantly, you host your site on your own VPS. The installation is quite simple and assumes you are running in the root account, if not you may need to add ‘sudo‘ to the commands to get root privileges. I will show you the step-by-step installation of the ELK Stack open-source log analytics platform on a Fedora 39.
Prerequisites
Before diving into the installation process, let’s ensure that you have everything you need:
- A server running one of the following operating systems: Fedora 39.
- It’s recommended that you use a fresh OS install to prevent any potential issues.
- You will need access to the terminal to execute commands. Fedora 39 provides the Terminal application for this purpose. It can be found in your Applications menu.
- A network connection or internet access to download the ELK Stack packages.
- A
non-root sudo useror access to theroot user. We recommend acting as anon-root sudo user, however, as you can harm your system if you’re not careful when acting as the root.
Install ELK Stack on Fedora 39
Step 1. Before diving into the ELK installation, it’s crucial to prepare your Fedora system by updating it and installing the necessary dependencies. Open your terminal and execute:
sudo dnf clean all
sudo dnf update
Step 2. Installing Java.
Elasticsearch requires Java to run. Install OpenJDK using the following commands:
sudo dnf install lsof java-17-openjdk java-17-openjdk-devel
Verify the installation with:
java -version
Step 3. Installing Elasticsearch.
Elasticsearch is the backbone of the ELK Stack. To install it, first import the GPG key:
sudo rpm --import https://packages.elastic.co/GPG-KEY-elasticsearch
Create a file named elasticsearch.repo in /etc/yum.repos.d/ and add the repository configuration.
sudo nano /etc/yum.repos.d/elasticsearch.repo
With the following configuration:
[elasticsearch-8.x]
name=Elasticsearch repository for 8.x packages
baseurl=https://artifacts.elastic.co/packages/8.x/yum
gpgcheck=1
gpgkey=https://artifacts.elastic.co/GPG-KEY-elasticsearch
enabled=1
autorefresh=1
type=rpm-md
Then, install Elasticsearch:
sudo dnf install elasticsearch-oss
Start and enable the Elasticsearch service:
sudo systemctl start elasticsearch
sudo systemctl enable elasticsearch
Step 4. Installing Kibana.
Kibana provides visualization capabilities for data stored in Elasticsearch. Install Kibana with:
sudo dnf install kibana-oss
Start and enable the Kibana service:
sudo systemctl enable kibana.service
sudo systemctl start kibana.service
Generate the enrollment token:
/usr/share/elasticsearch/bin/elasticsearch-create-enrollment-token -s kibana
Step 5. Installing Logstash.
Logstash is used for processing incoming data and feeding it into Elasticsearch. Now add the Logstash repository:
echo '[logstash-8.x]
name=Elastic repository for 8.x packages
baseurl=https://artifacts.elastic.co/packages/8.x/yum
gpgcheck=1
gpgkey=https://artifacts.elastic.co/GPG-KEY-elasticsearch
enabled=1
autorefresh=1
type=rpm-md' | sudo tee /etc/yum.repos.d/logstash.repo
Install Logstash using the following command:
sudo dnf install logstash
Configure the Logstash pipeline in /etc/logstash/conf.d/ to match your use case. See Logstash configuration examples.
Step 6. Configure Elasticsearch and Kibana.
Edit the configuration files for Elasticsearch (/etc/elasticsearch/elasticsearch.yml) and Kibana (/etc/kibana/kibana.yml). Set up user authentication and define access controls to secure your ELK Stack.
Step 7. Accessing Kibana Dashboard.
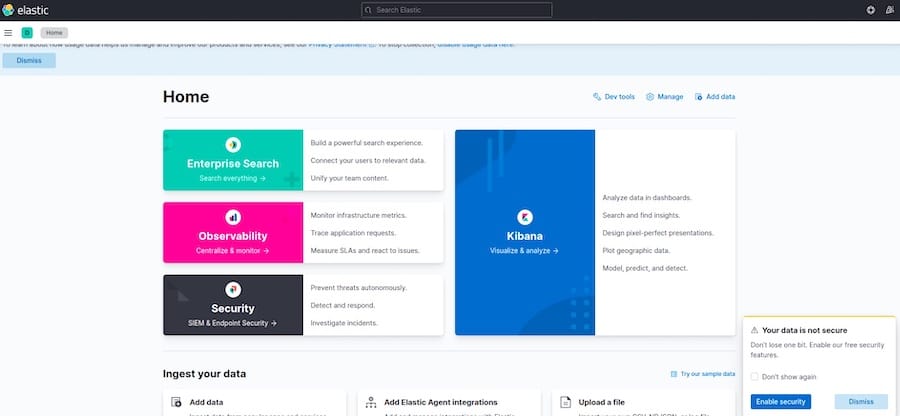
Access the Kibana dashboard through a web browser at http://localhost:5601. Use the enrollment token generated earlier to set up credentials and access Kibana.

Congratulations! You have successfully installed ELK Stack. Thanks for using this tutorial for installing the ELK Stack open-source log analytics platform on your Fedora 39 system. For additional or useful information, we recommend you check the official ELK Stack website.
