In this tutorial, we will show you how to install and configuration of Glances System Monitoring on your CentOS 7 server. For those of you who didn’t know, Glances is free software (licensed under LGPL) to monitor your GNU/Linux or BSD operating system from a text interface. Using it you can monitor CPU, Load Average, Memory, Network Interfaces, Disk I/O, File System spaces utilization, mounted devices, the total number of active processes, and top processes. There are many interesting options available in Glances. One of the main features is that you can set thresholds (careful, warning, and critical) in a configuration file, and information will be shown in colors that indicate the bottleneck in the system. Glances use the library libstatgrab to retrieve information from your system and it is developed in Python.
This article assumes you have at least basic knowledge of Linux, know how to use the shell, and most importantly, you host your site on your own VPS. The installation is quite simple and assumes you are running in the root account, if not you may need to add ‘sudo‘ to the commands to get root privileges. I will show you the step-by-step installation of Glances System Monitoring on a CentOS 7 server.
Prerequisites
- A server running one of the following operating systems: CentOS 7.
- It’s recommended that you use a fresh OS install to prevent any potential issues.
- SSH access to the server (or just open Terminal if you’re on a desktop).
- A
non-root sudo useror access to theroot user. We recommend acting as anon-root sudo user, however, as you can harm your system if you’re not careful when acting as the root.
Glances Features
Glances will display:
- Memory information includes RAM, swap, and free memory.
- The average CPU load of your system.
- CPU information like user-related applications, system programs, and idle programs.
- A total number of active and sleeping processes.
- Download and upload rates of your network connections.
- Disk I/O read and write details.
- Display currently mounted disk devices.
- Shows the current date and time at the bottom.
Install Glances System Monitoring on CentOS 7
Step 1. First, you need to enable the EPEL repository on your system.
## RHEL/CentOS 7 64-Bit ##
wget http://dl.fedoraproject.org/pub/epel/7/x86_64/e/epel-release-7-5.noarch.rpm
rpm -ivh epel-release-7-5.noarch.rpm
Once the EPEL repository is installed, you can install Glances by running the following command:
yum install epel-release
Step 2. Installing Glances.
Now enter the below command to install Glances:
yum install glances
Once the installation has finished, you can launch Glances by running the following command:
glances
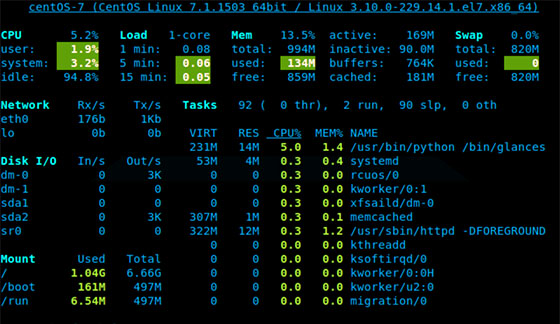
The output will look something like this:

In glances you’ll see a lot of information about the resources of your system: CPU, Load, Memory, Swap Network, Disk I/O, and Processes all on one page, by default the color code means:
- Green: Okay
- Blue: Caution
- Violet: Warning
- Red: Critical
When Glances is running, you can press some special keys to give commands to it:
- m: Sort processes by MEM%
- p: Sort processes by name
- c: Sort processes by CPU%
- d: Show/hide disk I/O stats
- a: Sort Processes automatically
- f: Show/hide file system statshddtemp
- i: Sort processes by I/O rate
- s: Show/hide sensors stats
- y: Show/hide hddtemp stats
- l: Show/hide logs
- n: Show/hide network stats
- x: Delete warning and critical logs
- h: Show/hide help screen
- q: Quit
- w: Delete warning logs
Congratulations! You have successfully installed Glances. Thanks for using this tutorial for installing Glances System Monitoring on your CentOS 7 system. For additional help or useful information, we recommend you to check the official Glances System Monitoring website.