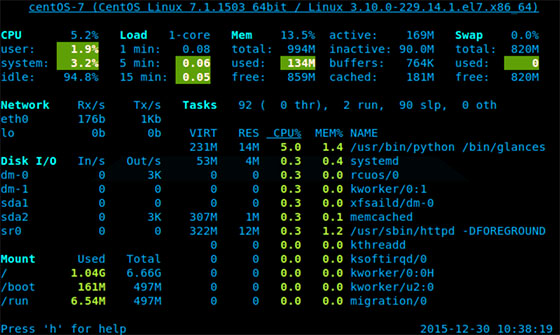
In this tutorial, we will show you how to install and configure of Glances System Monitoring Tool on your CentOS 7 server. For those of you who didn’t know, Glance is a cross-platform command-line tool written in Python to monitor Linux systems. You can use Glances to monitor CPU, Load Average, Memory, Network Interfaces, Disk I/O, Processes, and File System spaces utilization of your Linux system.
This article assumes you have at least basic knowledge of Linux, know how to use the shell, and most importantly, you host your site on your own VPS. The installation is quite simple and assumes you are running in the root account, if not you may need to add ‘sudo‘ to the commands to get root privileges. I will show you the step-by-step installation of Glances System Monitoring on a CentOS 7 server.
Prerequisites
- A server running one of the following operating systems: CentOS 7.
- It’s recommended that you use a fresh OS install to prevent any potential issues.
- SSH access to the server (or just open Terminal if you’re on a desktop).
- A
non-root sudo useror access to theroot user. We recommend acting as anon-root sudo user, however, as you can harm your system if you’re not careful when acting as the root.
Glances Features
- CPU Information (user-related applications, system core programs, and idle programs.
- Total memory Information including RAM, Swap, Free memory, etc.
- The average CPU load for the past 1min, 5mins, and 15 mins.
- Network Download/Upload rates of network connections.
- A total number of processes, active ones, sleeping processes, etc.
- Disk I/O related (read or write) speed details
- Currently mounted devices disk usages.
- Top processes with their CPU/Memory usage, Names, and location of the application.
- Shows the current date and time at the bottom.
- Highlights processes in Red that consume the highest system resources.
Install Glances System Monitoring Tool on CentOS 7
Step 1. First, you need to enable the EPEL repository on your system.
# wget http://dl.fedoraproject.org/pub/epel/7/x86_64/e/epel-release-7-5.noarch.rpm
# rpm -ivh epel-release-7-5.noarch.rpm
Step 2. Installing Glances System Monitoring Tool.
Once the EPEL repository is installed, you can install Glances by running the following command:
yum install glances
The installation has been completed. You may now try the following command in the shell and monitor your server resource usages:
glances -t 2

Glances color codes are as follows:
- Green: Okay
- Blue: Caution
- Violet: Warning
- Red: Critical
By default Glances thresholds are set at:
- Caution: 50
- Warning: 70
- Critical: 90
Congratulations! You have successfully installed Glances. Thanks for using this tutorial for installing Glances System Monitoring Tool on CentOS 7 system. For additional help or useful information, we recommend you to check the official Glances website.