![]()
In this tutorial, we will show you how to install Grafana on AlmaLinux 8. For those of you who didn’t know, Grafana is the open-source analytics and monitoring solution for every database such as Elasticsearch, Graphite, OpenTSDB, Prometheus, and InfluxDB. The application gives a beautiful dashboard and metric analytics.
This article assumes you have at least basic knowledge of Linux, know how to use the shell, and most importantly, you host your site on your own VPS. The installation is quite simple and assumes you are running in the root account, if not you may need to add ‘sudo‘ to the commands to get root privileges. I will show you through the step-by-step installation of the Grafana open-source analytics & monitoring on an AlmaLinux 8. You can follow the same instructions for Rocky Linux.
Prerequisites
- A server running one of the following operating systems: AlmaLinux 8.
- It’s recommended that you use a fresh OS install to prevent any potential issues.
- A
non-root sudo useror access to theroot user. We recommend acting as anon-root sudo user, however, as you can harm your system if you’re not careful when acting as the root.
Install Grafana on Almalinux 8
Step 1. First, let’s start by ensuring your system is up-to-date.
sudo dnf update
sudo dnf install epel-release
Step 2. Installing Grafana on AlmaLinux 8.
Now we add the Grafana RPM repository to your system:
sudo tee /etc/yum.repos.d/grafana.repo<<EOF

[grafana]
name=grafana
baseurl=https://packages.grafana.com/oss/rpm
repo_gpgcheck=1
enabled=1
gpgcheck=1
gpgkey=https://packages.grafana.com/gpg.key
sslverify=1
sslcacert=/etc/pki/tls/certs/ca-bundle.crt

EOF
When the repository for Grafana has been added, Grafana can be easily installed by running the commands below:
sudo dnf update
sudo dnf install grafana
To start, stop, restart, check status or enable Grafana server to run on system boot, run the commands:
sudo systemctl start grafana-server
sudo systemctl enable grafana-server
Step 3. Configure Firewall.
Configure the FirewallD to allow external machines to access the Grafana:
sudo firewall-cmd --add-port=3000/tcp --permanent
sudo firewall-cmd --reload
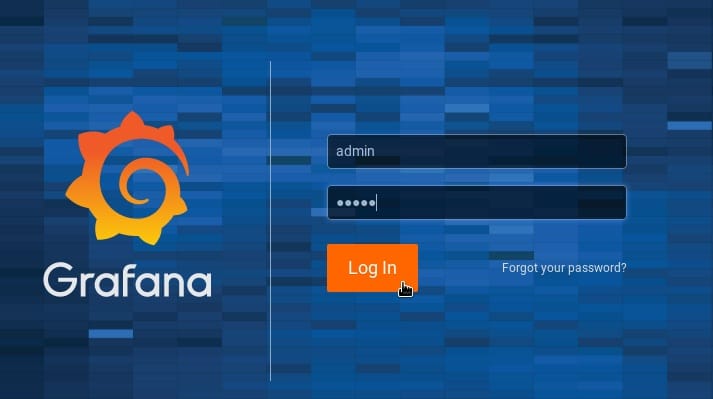
Step 4. Accessing Grafana Web interface.
Once successfully installed, now open your favorite browser and navigate to http://your-domain.com:3000 and complete the required steps to finish the installation. Use the credentials admin for both username and password.
Congratulations! You have successfully installed Grafana. Thanks for using this tutorial for installing Grafana open source dashboard monitoring tools on your AlmaLinux 8 system. For additional help or useful information, we recommend you check the official Grafana website.
[su_box title=”VPS Manage Service Offer” style=”bubbles” box_color=”#000000″ radius=”10″]If you don’t have time to do all of this stuff, or if this is not your area of expertise, we offer a service to do “VPS Manage Service Offer”, starting from $10 (Paypal payment). Please contact us to get the best deal![/su_box]