Monitoring server performance and visualizing infrastructure metrics have become essential aspects of modern system administration. Grafana stands out as one of the most powerful open-source platforms for data visualization and monitoring. With its intuitive interface and extensive compatibility with various data sources, Grafana has become the go-to solution for DevOps teams and system administrators worldwide. This comprehensive guide will walk you through the complete process of installing Grafana on CentOS Stream 10, from basic setup to advanced configuration.
Understanding Grafana and Its Benefits
Grafana is an open-source analytics and interactive visualization web application that connects to various data sources, allowing you to query, visualize, alert on, and understand your metrics regardless of where they’re stored. First released in 2014, Grafana has quickly become the industry standard for monitoring dashboards.
Key Features of Grafana:
- Beautiful, customizable dashboards with a variety of visualization options
- Support for multiple data sources including Prometheus, Graphite, InfluxDB, Elasticsearch, MySQL, PostgreSQL, and many more
- Powerful alerting system with notification capabilities
- User authentication and team-based permission controls
- Extensible plugin architecture for additional functionality
- Template variables for creating dynamic, reusable dashboards
Grafana’s popularity stems from its ability to transform complex time-series data into meaningful visual representations. It helps system administrators identify trends, anomalies, and potential issues before they impact system performance or user experience.
Prerequisites for Installation
Before installing Grafana on CentOS Stream 10, ensure your system meets the following requirements:
System Requirements:
- A server running CentOS Stream 10 with root or sudo privileges
- Minimum hardware specifications: 2 CPU cores, 2GB RAM, 10GB free disk space
- Internet connectivity for package downloads
- Updated system packages
To update your system packages, run:
sudo dnf update -y
sudo dnf upgrade -y
This preparatory step ensures all system packages are current, reducing potential compatibility issues during Grafana installation.
Installation Methods Overview
Grafana offers multiple installation methods on CentOS Stream 10. Each approach has its advantages and considerations.
Available Installation Methods:
- RPM Repository Installation – Recommended for automatic updates and easiest maintenance
- Standalone RPM Installation – Good for environments with limited internet access
- Binary tar.gz Installation – Offers more control over installation location
- Docker Installation – Ideal for containerized environments
The RPM repository method is generally recommended for most users as it provides the simplest update path and integrates well with the CentOS package management system.
Installing Grafana from RPM Repository
Installing Grafana via the official RPM repository ensures you receive automatic updates whenever you update your system packages. This method requires adding the Grafana repository to your system.
Step 1: Import the GPG Key
First, import the Grafana GPG key to verify package integrity:
wget -q -O gpg.key https://rpm.grafana.com/gpg.key
sudo rpm --import gpg.key
Step 2: Create Repository Configuration
Create a new repository configuration file:
sudo nano /etc/yum.repos.d/grafana.repoAdd the following content to the file:
[grafana]
name=grafana
baseurl=https://rpm.grafana.com
repo_gpgcheck=1
enabled=1
gpgcheck=1
gpgkey=https://rpm.grafana.com/gpg.key
sslverify=1
sslcacert=/etc/pki/tls/certs/ca-bundle.crt
Save and exit the editor.
Step 3: Install Grafana
To install Grafana OSS (open-source version), run:
sudo dnf install grafanaFor Grafana Enterprise, which includes additional enterprise features, use:
sudo dnf install grafana-enterpriseThe installation process will download and install Grafana along with any required dependencies.
Installing Grafana from Standalone RPM
If you prefer not to add a repository or have limited internet connectivity, you can install Grafana using a standalone RPM package.
Step 1: Download the RPM Package
Navigate to the Grafana download page and download the appropriate RPM package for CentOS:
wget https://dl.grafana.com/oss/release/grafana-[version]-1.x86_64.rpmReplace [version] with the desired Grafana version number.
Step 2: Install the Package
Install the downloaded package:
sudo rpm -ivh grafana-[version]-1.x86_64.rpmThis command will install Grafana and create the necessary service files and directories.
Installing Grafana Using Binary tar.gz
For users who need more control over the installation location or prefer not to use package managers, the binary tar.gz method provides an alternative.
Step 1: Download the Archive
Download the latest Grafana binary archive:
wget https://dl.grafana.com/oss/release/grafana-[version].linux-amd64.tar.gzStep 2: Extract the Archive
Extract the downloaded archive:
tar -zxvf grafana-[version].linux-amd64.tar.gzStep 3: Move to Desired Location
Move the extracted directory to your preferred location:
sudo mv grafana-[version] /opt/grafanaStep 4: Create a System Service
To run Grafana as a service, create a systemd service file:
sudo nano /etc/systemd/system/grafana-server.serviceAdd appropriate content to configure the service with paths to your installation.
Configuring Grafana Server
After installation, you’ll need to configure Grafana according to your requirements.
Main Configuration File
The main configuration file is located at /etc/grafana/grafana.ini. This file contains various settings for database connections, server properties, authentication methods, and more.
Key Configuration Sections:
- [server] – Controls HTTP settings, domain, and URL paths
- [database] – Database connection settings
- [security] – Security settings including admin password and user authentication
- [users] – User registration and default role settings
- [auth] – Authentication settings for various providers
- [log] – Logging configuration
To modify the configuration:
sudo nano /etc/grafana/grafana.iniMost settings have sensible defaults, but you might want to adjust the following common settings:
[server]
http_port = 3000
domain = your-domain.com
root_url = https://your-domain.com/grafana/

[security]
admin_user = admin
admin_password = your-secure-password
Save your changes before proceeding.
Starting and Enabling Grafana Service
After installation and configuration, you need to start the Grafana service and enable it to start automatically on system boot.
Start the Service
Start Grafana using systemctl:
sudo systemctl start grafana-serverEnable Service at Boot
Enable automatic startup at boot time:
sudo systemctl enable grafana-serverCheck Service Status
Verify that Grafana is running properly:
sudo systemctl status grafana-serverYou should see output indicating that Grafana is active and running. If there are any issues, the status output will provide information about errors.
Firewall Configuration
By default, Grafana uses port 3000. You need to configure your firewall to allow traffic on this port for external access.
For Firewalld (Default in CentOS Stream 10)
sudo firewall-cmd --zone=public --add-port=3000/tcp --permanent
sudo firewall-cmd --reload
For Iptables
If you’re using iptables instead:
sudo iptables -A INPUT -p tcp --dport 3000 -m state --state NEW -j ACCEPT
sudo service iptables save
Verify that the port is open and Grafana is accessible:
sudo netstat -tulpn | grep 3000This should show that Grafana is listening on port 3000.
Accessing Grafana Web Interface
After successful installation and firewall configuration, you can access the Grafana web interface using your browser.
Access URL
Open your web browser and navigate to:
http://your-server-ip:3000Replace your-server-ip with your server’s actual IP address or hostname.
Default Credentials
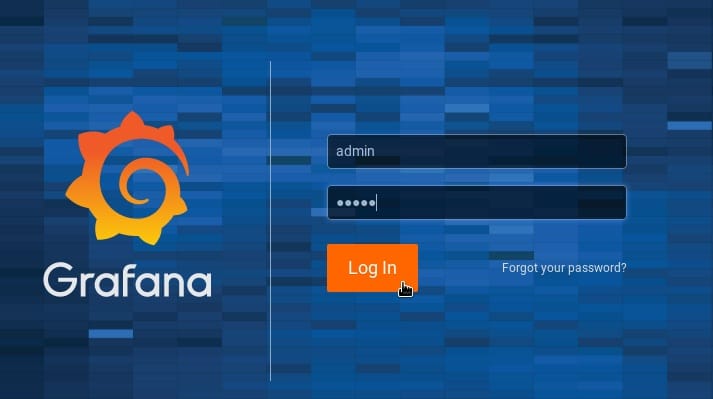
When prompted for login credentials, use the default:
- Username:
admin - Password:
admin
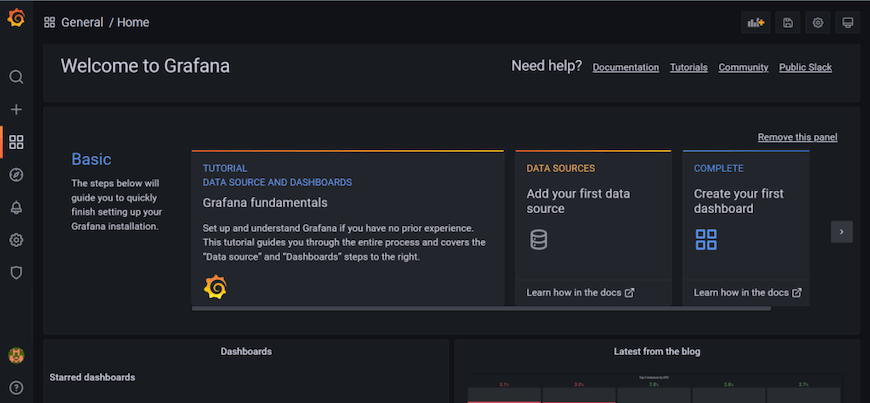
At first login, Grafana will prompt you to change the default password to a more secure one.

If you cannot access the interface, check the following:
- Grafana service status (
systemctl status grafana-server) - Firewall configuration
- Network connectivity to the server
- Logs at
/var/log/grafana/grafana.log
Initial Setup and Configuration
After logging in for the first time, you’ll need to perform some initial configuration to get the most out of Grafana.

Change Admin Password
For security reasons, change the default admin password immediately:
- Click on the user icon in the bottom left corner
- Select “Preferences”
- Click “Change Password”
- Enter and confirm your new password
Configure Data Sources
To visualize data, you need to add data sources:
- Click on “Configuration” (gear icon) in the sidebar
- Select “Data Sources”
- Click “Add data source”
- Choose your data source type (Prometheus, InfluxDB, MySQL, etc.)
- Enter the connection details
- Click “Save & Test” to verify the connection
Grafana supports numerous data sources, including time-series databases, SQL databases, and cloud services.
Creating Your First Dashboard
Dashboards are the heart of Grafana’s visualization capabilities. Creating a basic dashboard will help you understand how Grafana works.
Steps to Create a Dashboard
- Click on the “+” icon in the sidebar
- Select “Dashboard”
- Click “Add new panel”
- Select your data source
- Write your query using the appropriate query language
- Customize visualization options
- Click “Apply”
- Save your dashboard by clicking the save icon
Importing Pre-built Dashboards
Grafana offers a library of pre-built dashboards that you can import:
- Click on the “+” icon in the sidebar
- Select “Import”
- Enter the dashboard ID or upload a JSON file
- Configure the dashboard options
- Click “Import”
This allows you to quickly get started with professionally designed dashboards for common monitoring scenarios.
Security Best Practices
Securing your Grafana installation is critical, especially in production environments.
Change Default Credentials
As mentioned earlier, immediately change the default admin password after installation.
Implement HTTPS/SSL
For production environments, configure Grafana to use HTTPS:
- Generate SSL certificates
- Update the server section in
grafana.ini:
[server]
protocol = https
cert_file = /path/to/cert.pem
cert_key = /path/to/key.pem
User Authentication
Consider implementing more secure authentication methods:
- LDAP/Active Directory integration
- OAuth providers (Google, GitHub, etc.)
- SAML
Configure these in the [auth] section of your configuration file.
Regular Updates
Keep Grafana updated with security patches:
sudo dnf update grafanaBackup Configuration
Regularly backup your Grafana configuration and data:
sudo cp -r /etc/grafana /backup/grafana/config
sudo cp -r /var/lib/grafana /backup/grafana/data
Troubleshooting Common Issues
Even with careful installation, issues can arise. Here are solutions to common problems.
Service Fails to Start
If the Grafana service fails to start:
- Check logs:
sudo journalctl -u grafana-server - Verify permissions:
sudo chown -R grafana:grafana /var/lib/grafana - Check configuration:
sudo grafana-server -config /etc/grafana/grafana.ini -homepath /usr/share/grafana --pidfile /var/run/grafana/grafana-server.pid cfg:default.paths.logs=/var/log/grafana
Cannot Access Web Interface
If you can’t access the web interface:
- Verify the service is running:
sudo systemctl status grafana-server - Check firewall rules:
sudo firewall-cmd --list-all - Test local access:
curl http://localhost:3000 - Check for binding issues in logs:
grep "binding" /var/log/grafana/grafana.log
Service Stuck in “Activating” State
If the service gets stuck in “activating” state:
- Try changing the systemd service type:
sudo nano /usr/lib/systemd/system/grafana-server.service - Change
Type=notifytoType=simple - Reload systemd:
sudo systemctl daemon-reload - Restart Grafana:
sudo systemctl restart grafana-server
Updating Grafana
Keeping Grafana updated ensures you have the latest features and security patches.
Update via Repository
If you installed via repository:
sudo dnf update grafanaUpdate Standalone RPM
For standalone RPM installations, download the new RPM and install it:
sudo dnf install ./grafana-new-version.rpmBest Practices for Updates
- Always backup your configuration before updating
- Stop the Grafana service before major updates:
sudo systemctl stop grafana-server - Test updates in non-production environments first
- Check the release notes for breaking changes
Congratulations! You have successfully installed Grafana. Thanks for using this tutorial for installing Grafana on your CentOS Stream 10 system. For additional help or useful information, we recommend you check the official Grafana website.

