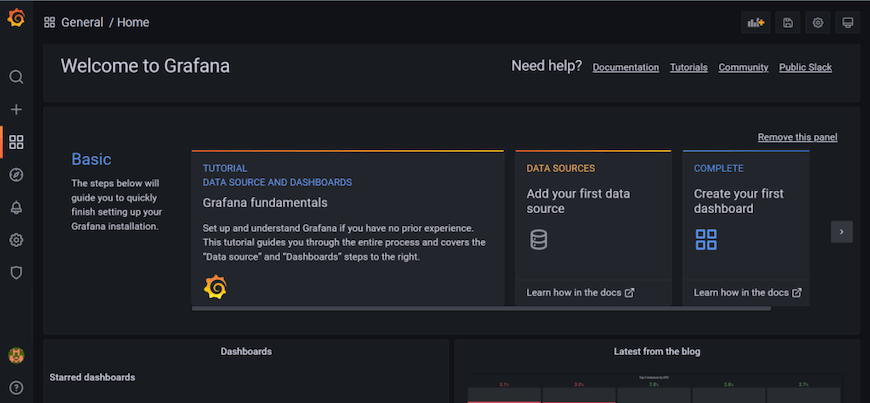
In this tutorial, we will show you how to install Grafana on Debian 12. In today’s fast-paced digital landscape, the ability to monitor and visualize data is paramount. Whether you’re managing a network, tracking server performance, or analyzing application logs, Grafana stands as a powerful open-source solution to empower you with real-time insights.
This article assumes you have at least basic knowledge of Linux, know how to use the shell, and most importantly, you host your site on your own VPS. The installation is quite simple and assumes you are running in the root account, if not you may need to add ‘sudo‘ to the commands to get root privileges. I will show you the step-by-step installation of the Grafana for monitoring and visualizing your data on a Debian 12 (Bookworm).
Prerequisites
- A server running one of the following operating systems: Debian 12 (Bookworm).
- It’s recommended that you use a fresh OS install to prevent any potential issues.
- SSH access to the server (or just open Terminal if you’re on a desktop).
- An active internet connection. You’ll need an internet connection to download the necessary packages and dependencies for Grafana.
- A
non-root sudo useror access to theroot user. We recommend acting as anon-root sudo user, however, as you can harm your system if you’re not careful when acting as the root.
Install Grafana on Debian 12 Bookworm
Step 1. Before we install any software, it’s important to make sure your system is up to date by running the following apt commands in the terminal:
sudo apt update
This command will refresh the repository, allowing you to install the latest versions of software packages.
Step 2. Installing Grafana on Debian 12.
First, import the GPG key used to sign Grafana packages:
wget -q -O - https://packages.grafana.com/gpg.key | sudo apt-key add -
Add the Grafana APT repository to your sources list:
sudo add-apt-repository "deb https://packages.grafana.com/oss/deb stable main"
Update the package lists to include Grafana:
sudo apt update
Finally, execute the following command to install Grafana using APT:
sudo apt install grafana
Ensure that Grafana starts automatically with your server and start it:
sudo systemctl start grafana-server
sudo systemctl enable grafana-server
Verify that Grafana is up and running without any issues:
sudo systemctl status grafana-server
Step 3. Firewall Configuration for Grafana.
To allow external access to your Grafana instance, configure your server’s firewall to permit traffic to the Grafana port (default is 3000). Use the following commands to allow traffic through the firewall:
sudo ufw allow 3000/tcp
sudo ufw reload
Step 4. Accessing Grafana Web Interface.
Finally, verify that Grafana is running by visiting http://localhost:3000 in your web browser. You should see the Grafana login page.
Note: If you are running Debian on a remote server, replace “localhost” with the IP address or hostname of your server.

Step 5. Troubleshooting.
Even with a smooth installation, issues can arise. Here are some common troubleshooting tips:
Common Installation Issues and Solutions √
- Grafana Service Not Starting: Check the service status using
sudo systemctl status grafana-serverfor error messages. Review Grafana’s log files for more details at/var/log/grafana/grafana.log. - Connection Issues: If you encounter problems connecting to your data sources, review your data source settings and credentials.
Logging and Debugging Grafana √
For in-depth troubleshooting, consult Grafana’s log files located at /var/log/grafana/grafana.log. These logs provide valuable insights into any issues Grafana may encounter.
Backing Up Grafana √
Protect your Grafana configuration by regularly exporting it. Explore different backup strategies to prevent data loss:
- Exporting Grafana Configuration: Grafana allows you to export its configuration through the web interface. Navigate to “Configuration” > “API Keys” and generate an API key. Then, use this key to export your configuration to a backup file.
-
Automated Backups: Consider automating the backup process using scripts and scheduling tools like cron.
Congratulations! You have successfully installed Grafana. Thanks for using this tutorial to install the latest version of the Grafana on Debian 12 Bookworm. For additional help or useful information, we recommend you check the official Grafana website.
