In this tutorial, we will show you how to install Grafana on Fedora 36. For those of you who didn’t know, Grafana is open-source analytics and monitoring solution for every database. It provides charts, graphs, and alerts for the web when connected to supported data sources. You can either install the open source version or the enterprise version. Both options would be free at the point of installing the service, but if you feel like you would like the Enterprise service that Grafana offers, you would only upgrade seamlessly with the enterprise version.
This article assumes you have at least basic knowledge of Linux, know how to use the shell, and most importantly, you host your site on your own VPS. The installation is quite simple and assumes you are running in the root account, if not you may need to add ‘sudo‘ to the commands to get root privileges. I will show you the step-by-step installation of the Grafana monitoring tool on a Fedora 36.
Prerequisites
- A server running one of the following operating systems: Fedora 36.
- It’s recommended that you use a fresh OS install to prevent any potential issues.
- SSH access to the server (or just open Terminal if you’re on a desktop).
- A
non-root sudo useror access to theroot user. We recommend acting as anon-root sudo user, however, as you can harm your system if you’re not careful when acting as the root.
Install Grafana on Fedora 36
Step 1. Before proceeding, update your Fedora operating system to make sure all existing packages are up to date. Use this command to update the server packages:
sudo dnf upgrade
sudo dnf update
sudo dnf install dnf-plugins-core
Step 2. Installing Grafana on Fedora 36.
By default, the Grafana package comes in the default repository of Fedora 36. Now run the following command below to install the latest version of Grafana to your Fedora system:
sudo dnf install grafana
Once is done, start the service of the Grafana server and then enable the same, so that it could start itself automatically with the system reboot:
sudo systemctl enable grafana-server
sudo systemctl start grafana-server
Step 3. Configure Firewall.
Configure the firewall HTTP port 3000 to allow traffic using the following commands below:
sudo firewall-cmd --zone=public --add-port=3000/tcp
sudo firewall-cmd --reload
Step 4. Accessing Grafana Web Interface.
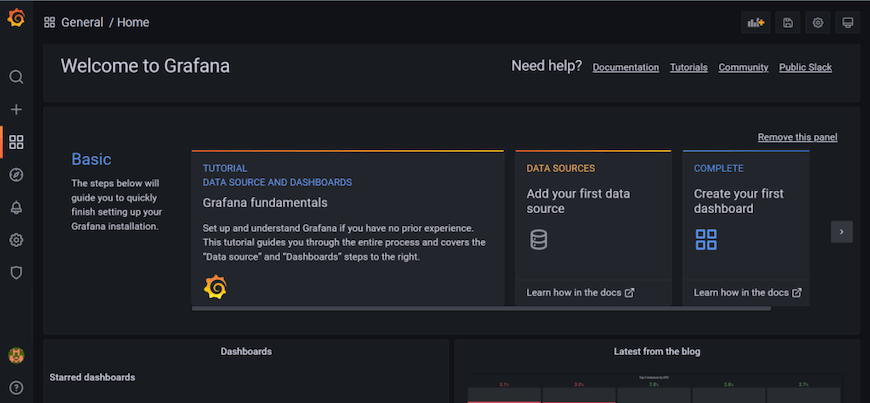
Once successfully installed, open your web browser and access Grafana using the URL http://your-IP-address:3000.
You will be asked to log in, so log in with the admin default credentials:
username: admin
password: admin

Congratulations! You have successfully installed Grafana. Thanks for using this tutorial for installing the Grafana monitoring tool on your Fedora 36 system. For additional help or useful information, we recommend you check the official Grafana website.

