Grafana is a powerful open-source platform for data visualization and monitoring, widely used by developers and system administrators to analyze metrics and logs from various data sources. With its user-friendly interface and extensive plugin ecosystem, Grafana allows users to create dynamic dashboards that provide real-time insights into their applications and infrastructure. This article will guide you through the step-by-step process of installing Grafana on Fedora 41, ensuring you have a robust monitoring solution at your fingertips.
Understanding Grafana
What is Grafana?
Grafana is an open-source analytics and monitoring platform that enables users to visualize data from multiple sources in a single dashboard. It supports a variety of data sources, including Prometheus, InfluxDB, Graphite, and many others. Its flexibility and extensibility make it a popular choice for organizations looking to gain insights from their data.
Use Cases for Grafana
- Monitoring application performance metrics.
- Visualizing infrastructure health and uptime.
- Creating business intelligence dashboards.
- Integrating with alerting systems for proactive management.
Prerequisites for Installation
System Requirements
Before installing Grafana, ensure that your system meets the following minimum hardware specifications:
- CPU: 1 GHz or higher.
- RAM: At least 1 GB (2 GB recommended).
- Disk Space: Minimum of 10 GB free space.
Software Dependencies
Your Fedora system should have the following packages installed:
- DNF: The default package manager for Fedora.
- CURL: For downloading files from the web.
User Permissions
You will need root or sudo privileges to install Grafana. Ensure your user account has the necessary permissions to perform administrative tasks.
Preparing Your Fedora System
Updating the System
The first step in preparing your system is to update all existing packages. Open your terminal and run the following command:
sudo dnf update -yThis command ensures that all installed packages are up-to-date, which can help prevent compatibility issues during the installation of Grafana.
Setting Up the Hostname
A fully qualified domain name (FQDN) can enhance accessibility to your Grafana instance. To set your hostname, use the following command:
hostnamectl set-hostname grafana.example.comReplace grafana.example.com with your desired hostname. This step is optional but recommended for better organization in larger environments.
Installing Grafana on Fedora 41
Adding the Grafana Repository
The next step is to add the official Grafana repository to your system. Create a new repository file using your preferred text editor:
sudo vi /etc/yum.repos.d/grafana.repoAdd the following content to the file:
[grafana]
name=Grafana
baseurl=https://rpm.grafana.com/oss/rpm/centos/7/x86_64
enabled=1
gpgcheck=1
gpgkey=https://rpm.grafana.com/gpg.key
This configuration points your system to the correct repository for downloading Grafana packages.
Importing GPG Key
The GPG key ensures that the packages you install are authentic and have not been tampered with. Import it using this command:
wget -q -O gpg.key https://rpm.grafana.com/gpg.key
sudo rpm --import gpg.key
Installing Grafana
You can now install Grafana using DNF. Run the following command:
sudo dnf install grafana -yThis command downloads and installs Grafana along with its dependencies. Once the installation completes, you will see a confirmation message indicating success.
Starting and Enabling Grafana Service
Starting the Grafana Server
The next step is to start the Grafana server. Use the following command:
sudo systemctl start grafana-serverEnabling Grafana at Boot
If you want Grafana to start automatically when your system boots, enable it with this command:
sudo systemctl enable grafana-serverChecking Service Status
You can verify if the Grafana service is running correctly by executing:
sudo systemctl status grafana-serverThis command provides output indicating whether the service is active (running) or if there are any issues that need addressing.
Configuring Grafana
Accessing the Web Interface
Your Grafana instance can be accessed via a web browser. Open your browser and navigate to:
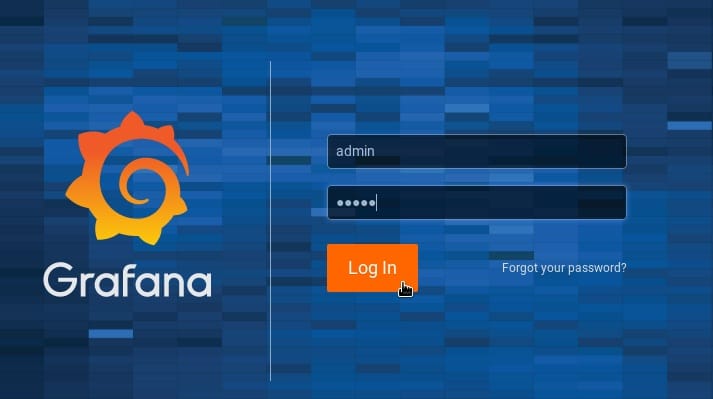
http://localhost:3000The default login credentials are:
- User: admin
- Password: admin (you will be prompted to change this on first login)

Initial Configuration Steps
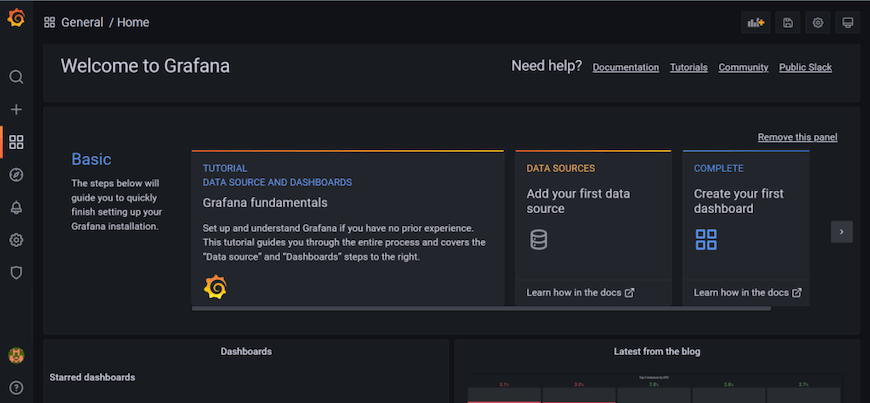
After logging in, you can begin configuring your dashboards. Start by adding data sources such as Prometheus or InfluxDB by navigating to Add Data Source. Choose your desired data source type and fill in the required connection details.

Configuring Database Options
You may choose between different database options for storing your metrics. By default, Grafana uses SQLite, but you can configure it to use MySQL or PostgreSQL by editing the configuration file located at:
/etc/grafana/grafana.iniTroubleshooting Common Issues
Installation Errors
If you encounter errors during installation, check for common issues such as missing dependencies or network connectivity problems. Ensure that your repository file is correctly configured and that you have internet access.
Service Not Starting
If the Grafana service fails to start, check its logs for error messages using this command:
sud journalctl -u grafana-server.service -bThis command displays logs related to the service, helping you identify any underlying issues such as port conflicts or configuration errors.
Congratulations! You have successfully installed Grafana. Thanks for using this tutorial for installing Grafana on your Fedora 41 system. For additional help or useful information, we recommend you check the official Grafana website.
