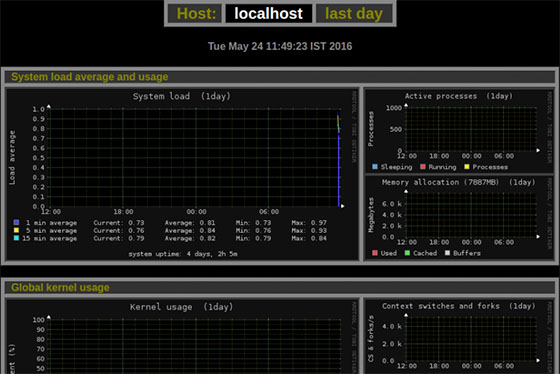
In this tutorial, we will show you how to install and configure of Monitorix Network Monitoring Tool on your CentOS 7. For those of you who didn’t know, Monitorix is a free, open-source, lightweight system monitoring tool designed to monitor as many services and system resources as possible. It has been created to be used under production UNIX/Linux servers, but due to its simplicity and small size, you may also use it on embedded devices as well.
This article assumes you have at least basic knowledge of Linux, know how to use the shell, and most importantly, you host your site on your own VPS. The installation is quite simple and assumes you are running in the root account, if not you may need to add ‘sudo‘ to the commands to get root privileges. I will show you the step-by-step installation of the Monitorix Network Monitoring Tool on a CentOS 7 server.
Prerequisites
- A server running one of the following operating systems: CentOS 7.
- It’s recommended that you use a fresh OS install to prevent any potential issues.
- SSH access to the server (or just open Terminal if you’re on a desktop).
- A
non-root sudo useror access to theroot user. We recommend acting as anon-root sudo user, however, as you can harm your system if you’re not careful when acting as the root.
Monitorix features
- System load average, active processes, per-processor kernel usage, global kernel usage, and memory allocation.
- Monitors Disk drive temperatures and health.
- Filesystem usage and I/O activity of filesystems.
- Network traffic usage up to 10 network devices.
- System services including SSH, FTP, Vsftpd, ProFTP, SMTP, POP3, IMAP, POP3, VirusMail, and Spam.
- MTA Mail statistics including input and output connections.
- Network port traffic including TCP, UDP, etc.
- FTP statistics with log file formats of FTP servers.
- Apache statistics of local or remote servers.
- MySQL statistics of local or remote servers.
- Squid Proxy Web Cache statistics.
- Fail2ban statistics.
- Monitor remote servers (Multihost).
- Ability to view statistics in graphs or in plain text tables per day, week, month, or year.
- Ability to zoom graphs for a better view.
- Ability to define the number of graphs per row.
- Built-in HTTP server.
Install Monitorix Network Monitoring Tool on CentOS 7
Step 1. First, you need to enable the EPEL repository on your system.
sudo yum install epel-release
yum -y update
Once you enable the EPEL repository you can install the required packages using the command:
yum install httpd rrdtool rrdtool-perl perl-libwww-perl perl-MailTools perl-MIME-Lite perl-CGI
Step 2. Installing Monitorix.
Install the Monitorix system monitoring tool on your server. It can be done with only one command:
yum install monitorix
Add Monitorix service to system start-up and start the service with the following commands:
systemctl start monitorx.service
systemctl enable monitorx.service
systemctl restart httpd.service
Step 3. Configure the Monitorix Network Monitoring Tool.
Once, you’ve started service, the program will start collecting system information according to the configuration settings in ‘/etc/monitorix.conf‘ file, and after a few minutes, you will start seeing system graphs from your browser at.
Step 4. Accessing Monitorix.
Monitorix will be available on HTTP port 8080 by default. Open your favorite browser and navigate to http://your-domain.com:8080/monitorix or http://server-ip:8080/monitorix and choose the Graph and hit ok to view the graph. If you are using a firewall, please open port 8080 to enable access to the control panel.

Congratulations! You have successfully installed Monitorix. Thanks for using this tutorial for installing Monitorix Network Monitoring Tool on your CentOS 7 system. For additional help or useful information, we recommend you to check the official Monitorix website.