System monitoring forms the backbone of effective server administration. Administrators need reliable tools to track performance metrics, identify bottlenecks, and maintain optimal system health. Monitorix emerges as a powerful, lightweight solution for comprehensive system monitoring on Rocky Linux 10 environments.
This guide provides detailed instructions for installing and configuring Monitorix on Rocky Linux 10. You’ll learn step-by-step procedures, troubleshooting techniques, and optimization strategies. Whether you’re managing a single server or multiple systems, this tutorial ensures successful deployment of robust monitoring capabilities.
The installation process covers prerequisites, dependency management, configuration optimization, and security implementation. By following these instructions, you’ll establish a professional-grade monitoring system that delivers actionable insights into your Rocky Linux infrastructure.
What is Monitorix?
Monitorix represents a free, open-source system monitoring tool specifically designed for Unix-like operating systems. This lightweight solution provides comprehensive server monitoring through an intuitive web-based interface, making it ideal for Rocky Linux 10 deployments.
Core Features and Capabilities
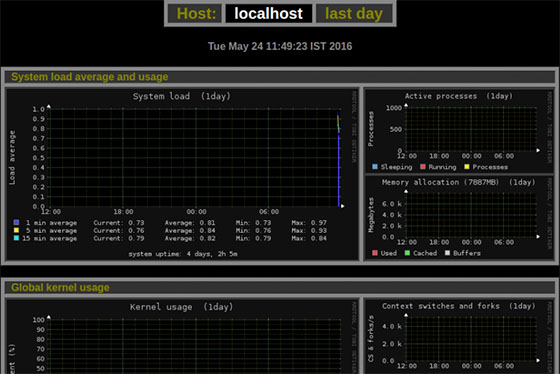
The monitoring platform excels in several key areas. System load monitoring tracks CPU usage, memory consumption, and process activity in real-time. Filesystem monitoring provides detailed insights into disk usage, I/O operations, and storage performance metrics. Network monitoring captures traffic patterns, bandwidth utilization, and connection statistics across all network interfaces.
Memory allocation tracking offers granular visibility into RAM usage patterns and swap file activity. The built-in HTTP server operates on port 8080/TCP by default, delivering monitoring data through clean, responsive web interfaces. These capabilities combine to create a comprehensive monitoring solution that scales effectively across enterprise environments.
Architecture Overview
Monitorix employs a modular architecture centered around two primary components. The Perl daemon collector (monitorix) continuously gathers system metrics and stores data in RRD databases. The CGI script (monitorix.cgi) processes web requests and generates dynamic graphs for browser-based viewing.
This separation ensures efficient resource utilization while maintaining responsive web interfaces. The architecture supports extensive customization through configuration files and modular plugins. Data visualization relies on proven RRDtool technology, ensuring accurate historical trending and performance analysis capabilities.
Prerequisites and System Requirements
Successful Monitorix installation requires specific system conditions and administrative access. Rocky Linux 10 serves as the target platform, though these procedures adapt to related RHEL-based distributions. Administrative privileges through root access or sudo permissions are mandatory for package installation and system configuration.
Network connectivity enables package downloads from official repositories and EPEL sources. Basic Linux command-line knowledge helps administrators navigate configuration procedures and troubleshooting scenarios. Hardware requirements remain minimal, with 512MB RAM and 1GB storage sufficient for standard monitoring deployments.
Consider increased resource allocation for environments monitoring multiple systems or requiring extended data retention periods. Virtual machines and containers support Monitorix installation with appropriate resource provisioning.
Pre-Installation System Preparation
System Updates
Begin installation procedures by updating your Rocky Linux 10 system to the latest package versions. Execute comprehensive system updates to ensure compatibility and security compliance.
sudo dnf update -y
sudo dnf upgrade -y
Verify your Rocky Linux version matches installation requirements:
cat /etc/rocky-release
hostnamectl
These commands confirm system version compatibility and identify any potential conflicts before proceeding with Monitorix installation.
Firewall Configuration Planning
Plan firewall modifications to accommodate Monitorix web interface access. The monitoring system requires port 8080/TCP for default web interface connectivity. Consider security implications and access control requirements before opening network ports.
Document current firewall configurations and plan rollback procedures if needed. Network topology and remote access requirements influence firewall rule implementation strategies.
Installing EPEL Repository
EPEL (Extra Packages for Enterprise Linux) provides essential packages not included in standard Rocky Linux repositories. Monitorix depends on EPEL packages for complete functionality and feature support.
Install EPEL repository using the following commands:
sudo dnf install epel-release -y
sudo dnf config-manager --set-enabled epel
Verify EPEL installation success:
sudo dnf repolist | grep epelSuccessful installation displays EPEL repository information in the output. This verification confirms package availability for subsequent installation steps.
Troubleshoot EPEL connectivity issues by checking network connectivity and DNS resolution. Proxy configurations may require additional setup for repository access in corporate environments.
Installing Required Dependencies
Perl Modules Installation
Monitorix requires specific Perl modules for data collection and graph generation functionality. Install essential dependencies using DNF package manager:
sudo dnf install perl-CGI perl-DBI perl-XML-Simple perl-Config-General -y
sudo dnf install perl-HTTP-Server-Simple perl-IO-Socket-SSL -y
RRDtool-perl enables graph generation and data visualization features:
sudo dnf install rrdtool-perl perl-RRD -yThese modules provide critical functionality for data processing, web interface operation, and statistical analysis capabilities.
Additional System Packages
Install supporting packages that enhance Monitorix functionality:
sudo dnf install httpd-tools wget curl -y
sudo dnf install lm_sensors hddtemp smartmontools -y
Apache httpd-tools provides authentication utilities for securing web interface access. Hardware monitoring tools like lm_sensors enable temperature monitoring and hardware health tracking.
Verify package installation status:
rpm -qa | grep -E "(perl|rrdtool|httpd-tools)"This command lists installed packages matching dependency requirements, confirming successful preparation for Monitorix installation.
Installing Monitorix Package
Install Monitorix from EPEL repository using DNF package manager:
sudo dnf install monitorix -yThe installation process downloads the package and configures initial file structures. Monitor installation output for error messages or dependency conflicts.
Verify installation completion and version information:
rpm -qi monitorix
monitorix -version
Check installation directory structure and file permissions:
ls -la /etc/monitorix/
ls -la /usr/share/monitorix/
ls -la /var/lib/monitorix/
These directories contain configuration files, web interface components, and data storage locations respectively. Proper permissions ensure secure operation and data integrity.
Monitorix Configuration
Main Configuration File
The primary configuration file /etc/monitorix/monitorix.conf controls all monitoring behavior and system settings. This comprehensive file requires careful customization for optimal performance.
Create a backup before making changes:
sudo cp /etc/monitorix/monitorix.conf /etc/monitorix/monitorix.conf.backupEdit the configuration file using your preferred text editor:
sudo nano /etc/monitorix/monitorix.confSystem identification settings personalize the monitoring interface:
title = My Rocky Linux 10 Server
hostname = server.example.com
theme_color = black
refresh_rate = 150
Interface customization enhances user experience and branding. The refresh rate controls automatic page updates, balancing responsiveness with system load.
Network and Security Configuration
Configure the built-in HTTP server for secure, controlled access:
host = 0.0.0.0
port = 8080
user = nobody
group = nobody
Host binding controls network interface access. Use 127.0.0.1 for localhost-only access or 0.0.0.0 for network-wide availability. Security considerations should guide this decision based on your environment.
Implement basic authentication for web interface security:
sudo htpasswd -c /etc/monitorix/.htpasswd adminConfigure authentication in monitorix.conf:
auth_enabled = y
auth_htpasswd = /etc/monitorix/.htpasswd
Monitoring Modules Configuration
Activate relevant monitoring modules based on your system requirements:
<graph_enable>
    system = y
    fs = y
    network = y
    memory = y
    cpu = y
    load = y
    disk = y
</graph_enable>
Each module controls specific monitoring categories. System monitoring tracks overall performance metrics. Filesystem monitoring provides storage insights. Network monitoring captures traffic statistics.
Fine-tune collection intervals and retention periods:
<system>
    data_collection_interval = 60
    data_retention_days = 365
</system>
These settings balance monitoring granularity with storage requirements and system performance impact.
Service Management and Startup
Configure Monitorix service for automatic startup and reliable operation:
sudo systemctl enable monitorix
sudo systemctl start monitorix
Verify service status and startup success:
sudo systemctl status monitorix
sudo systemctl is-enabled monitorix
Monitor service logs for startup errors or configuration issues:
sudo journalctl -u monitorix -f
sudo tail -f /var/log/monitorix/monitorix.log
Log monitoring reveals potential problems and provides troubleshooting insights. Service startup failures often indicate configuration errors or missing dependencies.
Firewall Configuration
Open the required port for web interface access using firewall-cmd:
sudo firewall-cmd --permanent --add-port=8080/tcp
sudo firewall-cmd --reload
Verify firewall rule implementation:
sudo firewall-cmd --list-ports
sudo firewall-cmd --list-all
Test connectivity from remote systems:
telnet your-server-ip 8080Successful connection confirms proper firewall configuration. Connection failures indicate firewall issues or service problems requiring further troubleshooting.
Consider security zone assignments for enhanced access control:
sudo firewall-cmd --permanent --zone=public --add-port=8080/tcpWeb Interface Access and Testing
Access the Monitorix web interface using your preferred browser:
http://your-server-ip:8080/monitorixThe initial dashboard displays system overview graphs and navigation menus. Graph selection allows detailed examination of specific monitoring categories.

Navigate through different monitoring sections:
- System graphs show CPU usage, load averages, and process statistics
- Network graphs display traffic patterns and interface utilization
- Filesystem graphs reveal storage usage and I/O performance
- Memory graphs track RAM allocation and swap usage
The responsive design supports mobile access and various screen resolutions. Bookmark frequently accessed graphs for quick reference during monitoring activities.
Advanced Configuration Options
Custom Configuration Files
Utilize the /etc/monitorix/conf.d/ directory for modular configuration management:
sudo mkdir -p /etc/monitorix/conf.d/Create specialized configuration files for specific requirements:
sudo nano /etc/monitorix/conf.d/custom-network.confThis approach maintains update-safe configurations that survive package upgrades. Modular files simplify configuration management in complex environments.
Performance Optimization
Optimize data collection intervals based on monitoring requirements:
<system>
    collect_every = 300
    max_historic_years = 2
</system>
Memory usage optimization reduces system impact:
<memory>
    max_threshold = 90
    alert_enabled = y
</memory>
Graph rendering settings control resource utilization:
<graph>
    size = medium
    color_theme = classic
</graph>
Integration with External Tools
Configure syslog integration for centralized logging:
<syslog>
    enabled = y
    facility = local0
</syslog>
Enable SNMP monitoring for network device integration:
sudo dnf install net-snmp-utils -yConfigure SNMP settings in monitorix.conf:
<snmp>
    community = public
    version = 2c
</snmp>
Email alert configuration provides proactive notifications:
<alert>
    enabled = y
    smtp_server = mail.example.com
    recipients = admin@example.com
</alert>
Monitoring and Maintenance
Establish regular maintenance procedures for optimal system performance. Log rotation prevents excessive disk usage:
sudo logrotate /etc/logrotate.d/monitorixMonitor data directory growth:
du -sh /var/lib/monitorix/Implement performance baseline procedures by documenting normal operating parameters. This baseline enables rapid identification of performance anomalies and capacity planning decisions.
Update procedures ensure security and feature improvements:
sudo dnf update monitorix
sudo systemctl restart monitorix
Create backup strategies for configuration files and historical data:
sudo tar -czf monitorix-backup-$(date +%Y%m%d).tar.gz /etc/monitorix/ /var/lib/monitorix/Troubleshooting Common Issues
Installation Problems
EPEL repository connectivity issues require network troubleshooting:
sudo dnf clean all
sudo dnf makecache
Package dependency conflicts may require manual resolution:
sudo dnf remove conflicting-package
sudo dnf install monitorix
Permission errors affect service startup and data collection:
sudo chown -R monitorix:monitorix /var/lib/monitorix/
sudo chmod 755 /var/lib/monitorix/
Service and Access Issues
Service startup failures often indicate configuration problems:
sudo monitorix -c /etc/monitorix/monitorix.conf -tThis command validates configuration syntax and identifies errors before service startup.
Web interface connectivity problems require systematic troubleshooting:
sudo ss -tlnp | grep 8080
sudo curl -I http://localhost:8080/monitorix
These diagnostic commands verify service binding and web server responsiveness.
Authentication errors may require htpasswd file recreation:
sudo rm /etc/monitorix/.htpasswd
sudo htpasswd -c /etc/monitorix/.htpasswd newuser
Performance and Data Collection Issues
Memory optimization reduces system resource consumption:
echo 'vm.swappiness=10' | sudo tee -a /etc/sysctl.conf
sudo sysctl -p
Disk space management prevents monitoring interruption:
find /var/lib/monitorix/ -name "*.rrd" -mtime +365 -deleteGraph generation problems often relate to RRDtool dependencies:
sudo dnf reinstall rrdtool-perl
sudo systemctl restart monitorix
Security Best Practices
Implement access control measures to protect monitoring data:
sudo ufw allow from trusted-ip-range to any port 8080Network security considerations include VPN access and reverse proxy implementation:
sudo nano /etc/nginx/sites-available/monitorix-sslConfigure SSL certificates for encrypted web interface access:
sudo certbot certonly --nginx -d monitoring.example.comRegular security updates maintain system protection:
sudo dnf update --securityImplement audit logging for monitoring access:
<audit>
    enabled = y
    log_file = /var/log/monitorix/access.log
</audit>
Incident response procedures should include monitoring system isolation and forensic data preservation protocols.
Congratulations! You have successfully installed Monitorix. Thanks for using this tutorial for installing the Monitorix monitoring tool on your Rocky Linux 10 system. For additional or useful information, we recommend you check the official Monitorix website.

