In this tutorial, we will show you how to install Prometheus on AlmaLinux 8. For those of you who didn’t know, Prometheus is open-source monitoring with a dimensional data model, flexible query language, efficient time-series database, and a modern alerting approach.
This article assumes you have at least basic knowledge of Linux, know how to use the shell, and most importantly, you host your site on your own VPS. The installation is quite simple and assumes you are running in the root account, if not you may need to add ‘sudo‘ to the commands to get root privileges. I will show you the step-by-step installation of the Prometheus monitoring system and time series database on an AlmaLinux 8. You can follow the same instructions for CentOS and Rocky Linux.
Prerequisites
- A server running one of the following operating systems: AlmaLinux 8, CentOS, and Rocky Linux 8.
- It’s recommended that you use a fresh OS install to prevent any potential issues.
- SSH access to the server (or just open Terminal if you’re on a desktop).
- A
non-root sudo useror access to theroot user. We recommend acting as anon-root sudo user, however, as you can harm your system if you’re not careful when acting as the root.
Install Prometheus on AlmaLinux 8
Step 1. First, let’s start by ensuring your system is up-to-date.
sudo dnf clean all
sudo dnf update
Step 2. Create system user and group for Prometheus.
Let us create a dedicated Prometheus user. Run the command below to create prometheus a system user and group:
sudo adduser -M -r -s /sbin/nologin prometheus
Next, create a new configuration directory ‘/etc/prometheus‘ and the data directory ‘/var/lib/prometheus‘:
sudo mkdir /etc/prometheus
sudo mkdir /var/lib/prometheus
Step 3. Installing Prometheus on AlmaLinux 8.
By default, Prometheus is available on the AlmaLinux 8 base repository. Now we run the following command to download the latest version of Prometheus on your system:
cd /usr/src
wget https://github.com/prometheus/prometheus/releases/download/v2.31.1/prometheus-2.31.1.linux-amd64.tar.gz
Next, extract the downloaded file:
tar -xf prometheus-2.31.1.linux-amd64.tar.gz
Now setup the environment variable ‘PROM_SRC‘ to the directory ‘/usr/src/prometheus-*‘:
export PROM_SRC=/usr/src/prometheus-*
sudo cp $PROM_SRC/prometheus.yml /etc/prometheus/
After that, copy the two Prometheus binary files, prometheus and promtool, under the extracted Prometheus archive directory to the /usr/local/bin directory:
sudo cp $PROM_SRC/prometheus /usr/local/bin/
sudo cp $PROM_SRC/promtool /usr/local/bin/
Step 4. Configure Prometheus.
All the Prometheus configurations should be present in /etc/prometheus/prometheus.yml file. Open the file using nano editor:
nano /etc/prometheus/prometheus.yml
Change the target from ‘localhost:9090‘ to the server IP address ‘192.168.77.20:9090‘ as below:
# A scrape configuration containing exactly one endpoint to scrape:
# Here it's Prometheus itself.
scrape_configs:
  # The job name is added as a label `job=<job_name>` to any timeseries scraped from this config.
  - job_name: "prometheus"

    # metrics_path defaults to '/metrics'
    # scheme defaults to 'http'.

    static_configs:
      - targets: ["192.168.77.20:9090"]
Save and close the file, then set proper ownership on configuration files and directories:
sudo chown prometheus:prometheus /etc/prometheus
sudo chown prometheus:prometheus /var/lib/prometheus
Step 5. Create Prometheus Systemd Service File.
Now we create a Prometheus systemd service file. We will use this service to manage the service starting and stopping:
sudo nano /etc/systemd/system/prometheus.service
Add the following file:
[Unit]
Description=Prometheus
Wants=network-online.target
After=network-online.target

[Service]
User=prometheus
Group=prometheus
Type=simple
ExecStart=/usr/local/bin/prometheus \
    --config.file /etc/prometheus/prometheus.yml \
    --storage.tsdb.path /var/lib/prometheus/ \
    --web.console.templates=/etc/prometheus/consoles \
    --web.console.libraries=/etc/prometheus/console_libraries

[Install]
WantedBy=multi-user.target
Save and close the file, then reload the systemd service to register the Prometheus service and start the Prometheus service:
sudo systemctl daemon-reload
sudo systemctl enable --now prometheus
sudo systemctl status prometheus
Step 6. Configure Firewall.
AlmaLinux comes with Firewalld enabled by default, and it will block other connections from other computers that are trying to access our Fastpanel service. We must open the appropriate ports so that the Prometheus resources can be accessed from other machines:
sudo firewall-cmd --add-port=9090/tcp --permanent
sudo firewall-cmd --reload
Step 7. Accessing Prometheus Web Interface.
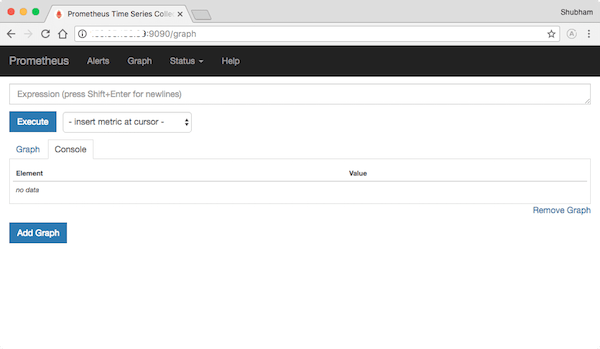
Once successfully installed, open your web browser and access the Prometheus using the URL http://192.168.77.20:9090/. You will be redirected to the following page:

Congratulations! You have successfully installed Prometheus. Thanks for using this tutorial for installing the Prometheus monitoring system tool on your AlmaLinux 8 system. For additional help or useful information, we recommend you check the official Prometheus website.