Monitoring server performance and health is crucial for maintaining a robust infrastructure. Among the many tools available, Prometheus stands out as a powerful open-source monitoring and alerting toolkit designed for reliability and scalability. This article provides a comprehensive step-by-step guide on how to install Prometheus on AlmaLinux 9, ensuring you can effectively monitor your systems.
Understanding Prometheus
Prometheus is an open-source monitoring solution that collects metrics from configured targets at specified intervals, evaluates rule expressions, and can trigger alerts based on those metrics. It features a multi-dimensional data model with time series data identified by metric name and key/value pairs, making it highly flexible.
Originally developed by SoundCloud in 2012, Prometheus has gained significant traction and was accepted into the Cloud Native Computing Foundation (CNCF) in 2016. Its rich ecosystem includes various integrations with other tools, making it a popular choice among developers and system administrators.
Prerequisites for Installation
Before diving into the installation process, ensure you meet the following prerequisites:
- System Requirements: A running instance of AlmaLinux 9 with sufficient resources (at least 1 GB RAM and 1 CPU core).
- Necessary Software: Access to the terminal with sudo privileges. Ensure that you have basic command-line knowledge.
- Network Considerations: Ensure your server has internet access to download necessary packages.
Step-by-Step Installation Guide
1. Preparing the Environment
The first step in installing Prometheus is preparing your AlmaLinux system. Begin by updating your system packages to ensure you have the latest versions and security patches.
sudo dnf update -yNext, install any necessary dependencies that will assist in the installation process:
sudo dnf install wget curl vim -y2. Adding Prometheus Repository
To simplify the installation process, add the Prometheus repository to your system. This allows you to easily install Prometheus using the package manager.
First, install the EPEL (Extra Packages for Enterprise Linux) repository:
sudo dnf install epel-release -yNext, add the Prometheus repository by executing the following command:
curl -s https://packagecloud.io/install/repositories/prometheus-rpm/release/script.rpm.sh | sudo bash3. Installing Prometheus
With the repository added, you can now install Prometheus using DNF:
sudo dnf install prometheus -yThis command will download and install Prometheus along with its dependencies. After installation, you can find the default configuration files located in `/etc/prometheus/`.
4. Configuring Prometheus
The next step involves configuring Prometheus to monitor your desired targets. Open the main configuration file using a text editor like nano:
sudo nano /etc/prometheus/prometheus.ymlThe default configuration file contains basic settings. You’ll need to modify it to include scrape configurations for your targets. Here’s an example of how to configure it:
```yaml
global:
scrape_interval: 15s # By default, scrape targets every 15 seconds.

scrape_configs:
- job_name: 'node'
static_configs:
- targets: ['localhost:9100'] # Replace with your target's address.
```
This configuration tells Prometheus to scrape metrics from Node Exporter running on localhost every 15 seconds.
After editing the configuration file, save your changes and exit the editor. Now, start and enable the Prometheus service so it runs on boot:
sudo systemctl start prometheus
sudo systemctl enable prometheus
Installing Node Exporter
1. What is Node Exporter?
Node Exporter is a tool that exposes hardware and OS metrics from *nix systems for collection by Prometheus. It provides insights into CPU usage, memory consumption, disk I/O statistics, and more.
2. Installation Steps
You can install Node Exporter directly from the same repository as Prometheus:
sudo dnf install node_exporter -yThis command installs Node Exporter on your system. Once installed, start and enable its service as well:
sudo systemctl start node_exporter
sudo systemctl enable node_exporter
Verifying the Installation
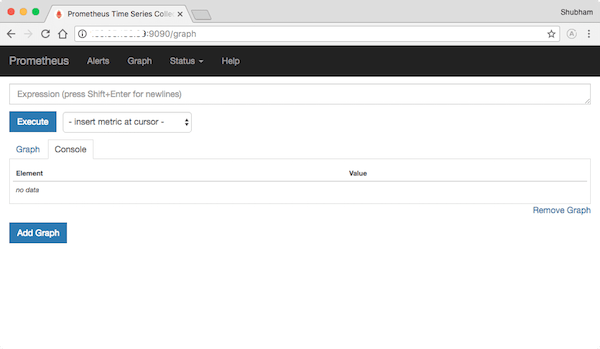
To ensure that both Prometheus and Node Exporter are running correctly, access the Prometheus web interface by navigating to `http://your-server-IP:9090` in your web browser.

You should see the Prometheus dashboard. To check if Node Exporter is successfully scraping metrics, click on “Status” in the top menu and then “Targets.” Here you should see Node Exporter listed as an active target.
Troubleshooting Common Issues
If you encounter issues during installation or while accessing metrics, consider these troubleshooting tips:
- No Metrics Found: Ensure that Node Exporter is running correctly by checking its status:
sudo systemctl status node_exporterIf it’s not active, restart it using:
sudo systemctl restart node_exporter - Error in Configuration File: If there are syntax errors in your `
prometheus.yml`, check for proper indentation and formatting.
You can validate YAML files using online validators or tools like `yamllint`. - Pinging Issues: Ensure that your firewall settings allow traffic on port 9090 (Prometheus) and port 9100 (Node Exporter). Use:
sudo firewall-cmd --permanent --add-port=9090/tcp
sudo firewall-cmd --permanent --add-port=9100/tcp
sudo firewall-cmd --reload
to open these ports.
- Error Logs: Check logs for any errors related to Prometheus:
sudo journalctl -u prometheus.serviceThis command will display recent log entries that may provide insight into any issues.
Congratulations! You have successfully installed Prometheus. Thanks for using this tutorial for installing the Prometheus monitoring system tool on your AlmaLinux 9 system. For additional help or useful information, we recommend you check the official Prometheus website.


