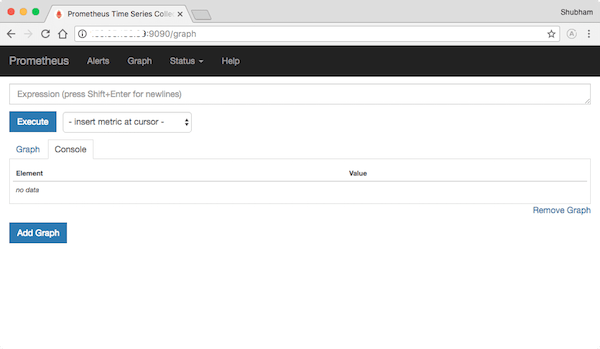
In this tutorial, we will show you how to install Prometheus on Debian 10. For those of you who didn’t know, Prometheus is an excellent open-source system and service monitoring system. It collects metrics from configured targets via HTTP calls at given intervals, evaluates rule expressions, displays the results, and can trigger alerts if some conditions are met.
This article assumes you have at least basic knowledge of Linux, know how to use the shell, and most importantly, you host your site on your own VPS. The installation is quite simple and assumes you are running in the root account, if not you may need to add ‘sudo‘ to the commands to get root privileges. I will show you through the step-by-step installation of the Prometheus monitoring system on a Debian 10 (Buster).
Prerequisites
- A server running one of the following operating systems: Debian 10 (Buster).
- It’s recommended that you use a fresh OS install to prevent any potential issues.
- A
non-root sudo useror access to theroot user. We recommend acting as anon-root sudo user, however, as you can harm your system if you’re not careful when acting as the root.
Install Prometheus on Debian 10 Buster
Step 1. Before running the tutorial below, it’s important to make sure your system is up to date by running the following apt commands in the terminal:
sudo apt update
Step 2. Create Prometheus Users.
Now we create a new user named ‘prometheus‘, and all Prometheus services will be running under the Prometheus user:
sudo groupadd --system prometheus
sudo useradd -s /sbin/nologin --system -g prometheus prometheus
Step 3. Installing Prometheus on Debian 10.
Now we download Prometheus packages from the official website using the wget command:
wget https://github.com/prometheus/prometheus/releases/download/v2.26.0/prometheus-2.26.0.linux-amd64.tar.gz
Next, extract the files in the archive:
tar xvzf prometheus-2.26.0.linux-amd64.tar.gz
The archive contains many important files, but here are the main ones you need to know.
- prometheus.yml: the configuration file for Prometheus. This is the file that you are going to modify in order to tweak your Prometheus server, for example, to change the scraping interval or to configure custom alerts;
- prometheus: the binary for your Prometheus server. This is the command that you are going to execute to launch a Prometheus instance on your Linux box;
- promtool: this is a command that you can run to verify your Prometheus configuration.
After that, move them to the bin directory:
cd Prometheus/prometheus-2.26.0.linux-amd64/
sudo cp prometheus promtool /usr/local/bin
Give permissions to the Prometheus user for the Prometheus binary:
sudo chown prometheus:prometheus /usr/local/bin/prometheus
Next, create a folder in the /etc folder for Prometheus and move the console files, console libraries, and the Prometheus configuration file to this newly created folder:
sudo mkdir /etc/prometheus
sudo cp -R consoles/ console_libraries/ prometheus.yml /etc/prometheus
Once upon, create a data folder at the root directory, with a Prometheus folder inside:
sudo mkdir -p data/prometheus
sudo chown -R prometheus:prometheus data/prometheus /etc/prometheus/*
Step 4. Create a Prometheus Systemd Service.
Go to the /lib/systemd/system folder and create a new file named prometheus.service:
cd /lib/systemd/system
sudo touch prometheus.service
Next, edit the newly created file, and paste the following content inside:
sudo nano prometheus.service
Add the following file:
[Unit]
Description=Prometheus
Wants=network-online.target
After=network-online.target

[Service]
Type=simple
User=prometheus
Group=prometheus
ExecStart=/usr/local/bin/prometheus \
  --config.file=/etc/prometheus/prometheus.yml \
  --storage.tsdb.path="/data/prometheus" \
  --web.console.templates=/etc/prometheus/consoles \
  --web.console.libraries=/etc/prometheus/console_libraries \
  --web.listen-address=0.0.0.0:9090 \
  --web.enable-admin-api

Restart=always

[Install]
WantedBy=multi-user.target
Save your file, enable your service at startup, and start your service:
sudo systemctl start prometheus
sudo systemctl enable prometheus
Step 5. Accessing Prometheus Web Interface.
Prometheus will be available on HTTP port 9090 by default. Open your favorite browser and navigate to http://your-domain.com:9090 or http://your-ip-address:9090 and complete the required steps to finish the installation.

Congratulations! You have successfully installed Prometheus. Thanks for using this tutorial for installing the latest version of the Prometheus monitoring system and time series database on the Debian system. For additional help or useful information, we recommend you check the official Prometheus website.