In this tutorial, we will show you how to install Prometheus on Fedora 38. Monitoring and alerting are indispensable aspects of modern system administration. They ensure the health, performance, and reliability of your infrastructure. Among the plethora of monitoring tools available, Prometheus stands out for its robust features and flexibility.
This article assumes you have at least basic knowledge of Linux, know how to use the shell, and most importantly, you host your site on your own VPS. The installation is quite simple and assumes you are running in the root account, if not you may need to add ‘sudo‘ to the commands to get root privileges. I will show you the step-by-step installation of the Prometheus monitoring tool on a Fedora 38.
Prerequisites
- A server running one of the following operating systems: Fedora 38.
- It’s recommended that you use a fresh OS install to prevent any potential issues.
- SSH access to the server (or just open Terminal if you’re on a desktop).
- An active internet connection. You’ll need an internet connection to download the necessary packages and dependencies for Prometheus.
- A
non-root sudo useror access to theroot user. We recommend acting as anon-root sudo user, however, as you can harm your system if you’re not careful when acting as the root.
Install Prometheus on Fedora 38
Step 1. Before we can install Prometheus on Fedora 38, it’s important to ensure that our system is up-to-date with the latest packages. This will ensure that we have access to the latest features and bug fixes and that we can install Prometheus without any issues:
sudo dnf update
Step 2. Installing Prometheus on Fedora 38.
We’ll start by creating a dedicated Prometheus user, which will enhance security during installation:
sudo useradd -m -s /bin/false prometheus
sudo su - prometheus
cd ~
Now, visit the Prometheus official website and download the latest version of Prometheus using the following command.
wget https://github.com/prometheus/prometheus/releases/download/v2.47.0/prometheus-2.47.0.linux-amd64.tar.gz
tar -xvf prometheus-2.47.0.linux-amd64.tar.gz
cd prometheus-2.47.0.linux-amd64
Step 3. Create a Prometheus Configuration File.
To navigate Prometheus’s realm effectively, you must provide it with a map. This is done through a configuration file:
nano /etc/prometheus/prometheus.yml
Add the following configuration:
global:
  scrape_interval: 10s

scrape_configs:
  - job_name: 'prometheus'
    scrape_interval: 5s
    static_configs:
      - targets: ['localhost:9090']
Save and close the file, then change the file ownership:
chown prometheus:prometheus /etc/prometheus/prometheus.yml
Step 4. Create a systemd Service for Prometheus.
Creating a systemd service file to manage the Prometheus service:
nano /etc/systemd/system/prometheus.service
Add the following lines:
[Unit]
Description=Prometheus
Wants=network-online.target
After=network-online.target

[Service]
User=prometheus
Group=prometheus
Type=simple
ExecStart=/usr/local/bin/prometheus \
    --config.file /etc/prometheus/prometheus.yml \
    --storage.tsdb.path /var/lib/prometheus/ \
    --web.console.templates=/etc/prometheus/consoles \
    --web.console.libraries=/etc/prometheus/console_libraries

[Install]
WantedBy=multi-user.target
With the systemd unit file in place, you can now start Prometheus as a service and enable it to start automatically at boot:
sudo systemctl daemon-reload
sudo systemctl start prometheus
sudo systemctl enable prometheus
To ensure that Prometheus is running without any issues, check its status using the following command:
sudo systemctl status prometheus
Step 5. Configure Firewall.
Check the status of the firewalld service by running the following command:
sudo systemctl status firewalld
If the firewalld service is not running, start it by running the following command:
sudo systemctl start firewalld
Add a new firewall rule to allow incoming connections to the Prometheus service. For example, to allow incoming connections on port 9090, run the following command:
sudo firewall-cmd --zone=public --add-port=9090/tcp --permanent
Step 6. Accessing Prometheus Web UI.
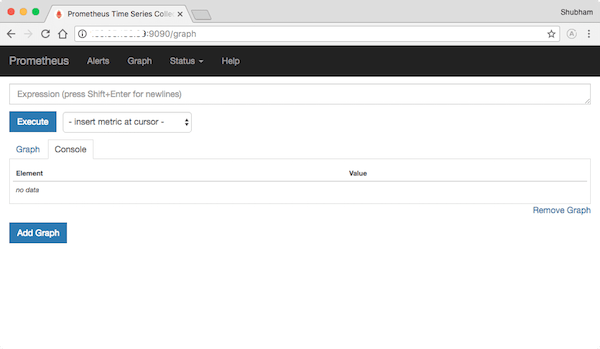
Prometheus provides a web-based interface for monitoring and querying metrics. Open a web browser and navigate to either http://localhost:9090 or http://<your-server-IP>:9090.

Congratulations! You have successfully installed Prometheus. Thanks for using this tutorial for installing the Prometheus monitoring and alerting tool on your Fedora 38 system. For additional help or useful information, we recommend you check the official Prometheus website.

