How To Install Prometheus on Fedora 41

Prometheus is a powerful open-source monitoring and alerting toolkit designed for reliability and scalability. It is widely used in cloud-native environments to monitor systems, applications, and services. Fedora 41, with its cutting-edge features and modern software stack, provides an excellent platform for hosting Prometheus. In this guide, we will walk you through the step-by-step process of installing and configuring Prometheus on Fedora 41.
Prerequisites
Before we dive into the installation process, ensure that your system meets the following prerequisites:
- A server running Fedora 41
- A user with sudo privileges
- At least 2 GB of RAM and 10 GB of free disk space
Additionally, it’s important to make sure your system is up-to-date. Run the following command to update all packages:
sudo dnf update -yNext, install some essential tools that will be used during the installation process:
sudo dnf install curl wget nano -yStep-by-Step Installation of Prometheus on Fedora 41
Downloading Prometheus
The first step in installing Prometheus is downloading the latest version from the official repository. You can do this using the wget command:
wget https://github.com/prometheus/prometheus/releases/download/v3.0.0/prometheus-3.0.0.linux-amd64.tar.gz
Once the download is complete, extract the tarball:
tar -xvf prometheus-3.0.0.linux-amd64.tar.gzSetting Up Prometheus Directories
Now that we have extracted the files, let’s create the necessary directories for Prometheus:
sudo mkdir /etc/prometheus /var/lib/prometheusNext, move the binaries to a directory in your system’s PATH:
sudo mv prometheus-3.0.0.linux-amd64/prometheus /usr/local/bin/
sudo mv prometheus-3.0.0.linux-amd64/promtool /usr/local/bin/
Creating a Dedicated User for Prometheus
For security purposes, it’s a good practice to run Prometheus under a dedicated user with limited privileges. Create a new user called “prometheus” without login access:
sudo useradd --no-create-home --shell /bin/false prometheusNow set ownership of the necessary directories to this user:
sudo chown -R prometheus:prometheus /etc/prometheus /var/lib/prometheus
sudo chown prometheus:prometheus /usr/local/bin/prometheus /usr/local/bin/promtool
Configuring Prometheus
Creating the Configuration File
The main configuration file for Prometheus is called prometheus.yml. Let’s create it inside the /etc/prometheus/ directory:
sudo nano /etc/prometheus/prometheus.ymlAdd the following basic configuration to monitor your local machine:
global:
  scrape_interval: 15s

scrape_configs:
  - job_name: 'prometheus'
    static_configs:
      - targets: ['localhost:9090']
This configuration tells Prometheus to scrape metrics from itself every 15 seconds.
Setting Up Systemd Service for Prometheus
To ensure that Prometheus starts automatically at boot and can be managed easily, we will create a systemd service file.
sudo nano /etc/systemd/system/prometheus.serviceAdd the following content to define how systemd should manage Prometheus:
[Unit]
Description=Prometheus Monitoring System
Wants=network-online.target
After=network-online.target

[Service]
User=prometheus
Group=prometheus
Type=simple
ExecStart=/usr/local/bin/prometheus \
  --config.file=/etc/prometheus/prometheus.yml \
  --storage.tsdb.path=/var/lib/prometheus/

[Install]
WantedBy=multi-user.target
Enabling and Starting Prometheus Service
Now that we have created the service file, let’s reload systemd to apply the changes:
sudo systemctl daemon-reloadYou can now enable and start the Prometheus service with these commands:
sudo systemctl enable prometheus --now
sudo systemctl start prometheus
Accessing Prometheus Web UI
If everything was set up correctly, Prometheus should now be running on port 9090. You can verify its status by running:
sudo systemctl status prometheusIf it’s active (running), open your web browser and navigate to:
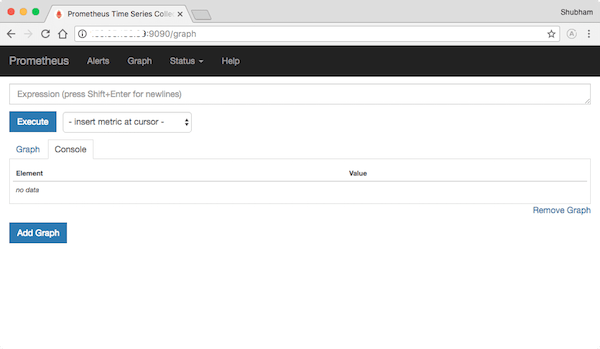
http://localhost:9090/graphThis will open the Prometheus web interface where you can query metrics and visualize data.

Installing Node Exporter for System Metrics (Optional)
If you want to monitor your server’s hardware metrics such as CPU usage, memory consumption, and disk I/O, you can install Node Exporter alongside Prometheus.
Downloading Node Exporter
You can download Node Exporter from its official GitHub releases page with this command:
wget https://github.com/prometheus/node_exporter/releases/download/v1.8.2/node_exporter-1.8.2.linux-amd64.tar.gzExtract it using:
tar xvf node_exporter-1.8.2.linux-amd64.tar.gzCreate a Node Exporter User and Set Up as a Service
Create a dedicated user for Node Exporter:
sudo useradd --no-create-home --shell /bin/false node_exporterCreate a systemd service file for Node Exporter:
sudo nano /etc/systemd/system/node_exporter.service

[Unit]
Description=Node Exporter

[Service]
User=node_exporter
ExecStart=/usr/local/bin/node_exporter

[Install]
WantedBy=multi-user.target
Reload systemd and start Node Exporter:
sudo systemctl daemon-reload
sudo systemctl enable node_exporter --now
sudo systemctl start node_exporter
Troubleshooting Common Issues
- The Prometheus service isn’t starting: Check logs using `
journalctl -u prometheus.service`..Ensure that all paths in your service file are correct. - You can’t access the web UI at port 9090: Make sure that your firewall allows traffic on port 9090 by running `
sudo firewall-cmd --add-port=9090/tcp --permanent`. - No metrics are being scraped:: Verify that your targets are correctly configured in `
prometheus.yml`. - Error messages in logs related to permissions:: Ensure that all necessary files and directories are owned by the “
prometheus” user. - The server runs out of disk space quickly: Consider adjusting retention policies or increasing storage capacity.
- The web UI is slow or unresponsive: Check resource usage (CPU/RAM) or consider scaling out by running multiple instances of Prometheus.
- Error “bind address already in use” when starting Node Exporter or Prometheus: Ensure no other services are using these ports.
- Trouble accessing Node Exporter metrics from Prometheus: Verify that Node Exporter’s port (9100) is open in your firewall settings.
Congratulations! You have successfully installed Prometheus. Thanks for using this tutorial for installing the Prometheus monitoring and alerting tool on Fedora 41 system. For additional help or useful information, we recommend you check the official Prometheus website.