In this tutorial, we will show you how to install Prometheus on Ubuntu 20.04 LTS. For those of you who didn’t know, Prometheus is an excellent open-source monitoring system that allows us to collect metrics from our applications and store them in a database, especially a time-series-based DB. The biggest advantage of Prometheus is the query language it provides for data processing.
This article assumes you have at least basic knowledge of Linux, know how to use the shell, and most importantly, you host your site on your own VPS. The installation is quite simple and assumes you are running in the root account, if not you may need to add ‘sudo‘ to the commands to get root privileges. I will show you through the step-by-step installation of Prometheus on Ubuntu 20.04 Focal Fossa. You can follow the same instructions for Ubuntu 18.04, 16.04, and any other Debian-based distribution like Linux Mint.
Prerequisites
- A server running one of the following operating systems: Ubuntu 20.04, 18.04, and any other Debian-based distribution like Linux Mint or elementary OS.
- It’s recommended that you use a fresh OS install to prevent any potential issues.
- A
non-root sudo useror access to theroot user. We recommend acting as anon-root sudo user, however, as you can harm your system if you’re not careful when acting as the root.
Install Prometheus on Ubuntu 20.04 LTS Focal Fossa
Step 1. First, make sure that all your system packages are up-to-date by running the following apt commands in the terminal.
sudo apt update
sudo apt upgrade
Step 2. Installing Nginx web server.
Nginx is available in the default Ubuntu repositories. To install it run the following command:
sudo apt install nginx
Once the installation is completed, run the commands to enable Nginx to automatically startup when your server starts:
sudo systemctl stop nginx.service
sudo systemctl start nginx.service
sudo systemctl enable nginx.service
Step 3. Create Prometheus Users.
We have to create the user and group called Prometheus and also the directory called Prometheus:
sudo useradd -s /sbin/nologin --system -g prometheus prometheus
sudo mkdir /var/lib/prometheus
for i in rules rules.d files_sd; do sudo mkdir -p /etc/prometheus/${i}; done
Step 4. Installing Prometheus on Ubuntu 20.04.
Now we download the latest stable release of Prometheus using the wget command:
mkdir -p /tmp/prometheus && cd /tmp/prometheus
curl -s https://api.github.com/repos/prometheus/prometheus/releases/latest | grep browser_download_url | grep linux-amd64 | cut -d '"' -f 4 | wget -qi -
tar xvf prometheus*.tar.gz
Once file extraction was completed, then move the prometheus and promtool binaries under the extracted Prometheus archive folder to /usr/local/bin directory:
sudo mv prometheus promtool /usr/local/bin/
Step 5. Configure Prometheus.
We will create the configuration file named prometheus.yml in the /etc/prometheus directory:
sudo mv prometheus.yml /etc/prometheus/prometheus.yml
sudo mv consoles/ console_libraries/ /etc/prometheus/
sudo nano /etc/prometheus/prometheus.yml
The content of prometheus.yml is as follow:
my global config
global:
scrape_interval: 15s # Set the scrape interval to every 15 seconds. Default is every 1 minute.
evaluation_interval: 15s # Evaluate rules every 15 seconds. The default is every 1 minute.
# scrape_timeout is set to the global default (10s).
Alertmanager configuration
alerting:
alertmanagers:
static_configs: targets:
# - alertmanager:9093
Load rules once and periodically evaluate them according to the global 'evaluation_interval'.
rule_files:
# - "first_rules.yml"
# - "second_rules.yml"
A scrape configuration containing exactly one endpoint to scrape:
Here it's Prometheus itself.
scrape_configs:
# The job name is added as a label job= to any timeseries scraped from this config.
job_name: 'prometheus'
metrics_path defaults to '/metrics'
scheme defaults to 'http'.
static_configs:
targets: ['localhost:9090']
To check the version of Prometheus installed, run the command:
prometheus --version
Step 6. Create a Prometheus Systemd Service.
Now, we will create a file for the systemd service:
sudo nano /etc/systemd/system/prometheus.service
Add the following file:
[Unit]
Description=Prometheus
Documentation=https://prometheus.io/docs/introduction/overview/
Wants=network-online.target
After=network-online.target

[Service]
Type=simple
User=prometheus
Group=prometheus
ExecReload=/bin/kill -HUP \$MAINPID
ExecStart=/usr/local/bin/prometheus \
  --config.file=/etc/prometheus/prometheus.yml \
  --storage.tsdb.path=/var/lib/prometheus \
  --web.console.templates=/etc/prometheus/consoles \
  --web.console.libraries=/etc/prometheus/console_libraries \
  --web.listen-address=0.0.0.0:9090 \
  --web.external-url=

SyslogIdentifier=prometheus
Restart=always

[Install]
WantedBy=multi-user.target
Then, change the ownership of these directories to Prometheus user and group:
for i in rules rules.d files_sd; do sudo chown -R prometheus:prometheus /etc/prometheus/${i}; done
for i in rules rules.d files_sd; do sudo chmod -R 775 /etc/prometheus/${i}; done
sudo chown -R prometheus:prometheus /var/lib/prometheus/
Once you are done with the above configurations, reload systemd using the following command:
sudo systemctl daemon-relaod
sudo systemctl start prometheus
sudo systemctl enable prometheus
Step 7. Configure Firewall.
Meanwhile, you need to make sure that your firewall is configured to allow traffic on HTTP (80), HTTPS (443) and 9090 ports. Nginx registers itself as a service with ufw :
sudo ufw allow in "Nginx Full"
sudo ufw allow 9090/tcp
Step 8. Accessing Prometheus Web Interface.
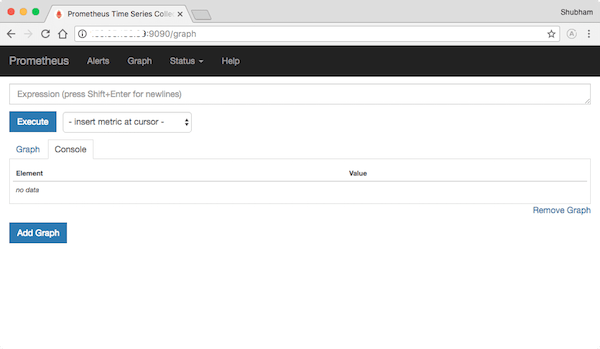
Prometheus will be available on HTTP port 9090 by default. Open your favorite browser and navigate to http://your-domain.com:9090 or http://server-ip-addreess:9090 and complete the required steps to finish the installation.

Congratulations! You have successfully installed Prometheus. Thanks for using this tutorial for installing Prometheus open-source monitoring on your Ubuntu 20.04 LTS (Focal Fossa). For additional help or useful information, we recommend you check the official Prometheus website.

