How To Install Prometheus on Ubuntu 24.04 LTS

Prometheus, a powerful open-source monitoring and alerting system, has become an essential tool for managing modern infrastructure. Its ability to collect and store metrics, coupled with its flexible querying language and robust alerting capabilities, makes it an ideal choice for monitoring servers, applications, and services. In this article, we will guide you through the process of installing Prometheus on Ubuntu 24.04 LTS, providing step-by-step instructions, troubleshooting tips, and additional resources to help you get started with this invaluable monitoring solution.
Prerequisites
Before diving into the installation process, it’s crucial to ensure that your system meets the necessary requirements for running Prometheus. Ubuntu 24.04 LTS should have at least 2 GB of RAM, 2 CPU cores, and 20 GB of disk space for optimal performance. You will also need sudo access to execute the commands throughout this tutorial. Additionally, make sure that your system has the required software dependencies, such as wget and tar, and that your network configuration allows access to the Prometheus download site.
Step 1: Update System Packages
To begin, it’s essential to update your system packages to ensure that you have the latest security patches and compatible versions of the required dependencies. Open a terminal and run the following command:
sudo apt update && sudo apt upgrade -yThis command will update the package list and upgrade any outdated packages to their latest versions, keeping your system secure and up-to-date.
Step 2: Create a System User and Group for Prometheus
To enhance security, it’s recommended to create a dedicated system user and group for running Prometheus. This ensures that Prometheus runs with limited permissions and reduces the potential impact of any security vulnerabilities. Execute the following command to create a system user named “prometheus“:
sudo useradd --no-create-home --shell /bin/false prometheusThis command creates a user without a home directory and with a shell that prevents login, providing an additional layer of security.
Step 3: Create Directories for Prometheus
Next, we need to create specific directories for storing Prometheus configuration files and data. Run the following commands to create the necessary directories and set the appropriate ownership:
sudo mkdir /etc/prometheus /var/lib/prometheus
sudo chown prometheus:prometheus /var/lib/prometheus
The /etc/prometheus directory will store the Prometheus configuration files, while the /var/lib/prometheus directory will be used for storing the collected metrics data. Setting the ownership to the prometheus user and group ensures that Prometheus has the necessary permissions to access and modify these directories.
Step 4: Download Prometheus
To download the latest stable release of Prometheus, visit the official Prometheus download page at https://prometheus.io/download/. At the time of writing, the latest version is 2.46.0. Use the following commands to download and extract the Prometheus archive:
cd /tmp
wget https://github.com/prometheus/prometheus/releases/download/v2.54.1/prometheus-2.54.1.linux-amd64.tar.gz
tar -xvf prometheus-2.54.1.linux-amd64.tar.gz
These commands navigate to the /tmp directory, download the Prometheus archive using wget, and extract its contents using the tar command. Make sure to replace the version number in the URL with the latest release available.
Step 5: Configure Prometheus
Prometheus uses a YAML configuration file to specify its settings and scrape targets. The default configuration file, prometheus.yml, is located in the extracted Prometheus directory. We need to move this file to the /etc/prometheus directory and set the appropriate ownership. Use the following commands:
sudo mv prometheus-2.46.0.linux-amd64/prometheus.yml /etc/prometheus/
sudo chown prometheus:prometheus /etc/prometheus/prometheus.yml
You can now customize the prometheus.yml file to define your desired scrape targets and other configuration options. For example, you can add a scrape_config section to collect metrics from a specific endpoint or modify the global settings according to your requirements.
Step 6: Start Prometheus
To manage Prometheus as a systemd service, we need to create a service file. This allows us to easily start, stop, and automatically run Prometheus on system boot. Create a new file named prometheus.service in the /etc/systemd/system directory using the following command:
sudo nano /etc/systemd/system/prometheus.serviceAdd the following content to the file:
[Unit]
Description=Prometheus
Wants=network-online.target
After=network-online.target

[Service]
User=prometheus
Group=prometheus
Type=simple
ExecStart=/usr/local/bin/prometheus \
    --config.file /etc/prometheus/prometheus.yml \
    --storage.tsdb.path /var/lib/prometheus/ \
    --web.console.templates=/etc/prometheus/consoles \
    --web.console.libraries=/etc/prometheus/console_libraries

[Install]
WantedBy=multi-user.target
Save the file and exit the editor. Then, run the following commands to reload the systemd configuration, start the Prometheus service, and enable it to start automatically on system boot:
sudo systemctl daemon-reload
sudo systemctl start prometheus
sudo systemctl enable prometheus
Step 7: Access the Prometheus Web Interface
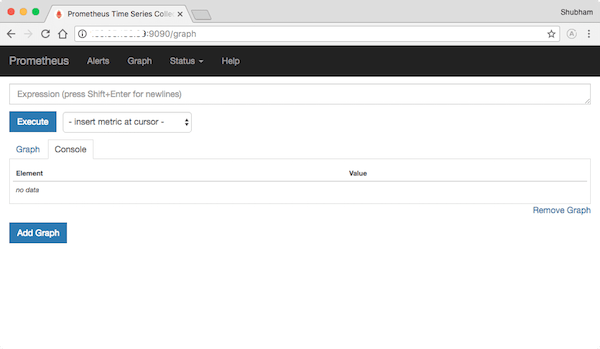
Prometheus provides a web-based user interface for querying metrics and viewing the status of the monitoring system. By default, Prometheus listens on port 9090. To access the Prometheus web UI, open a web browser and navigate to:
http://<your-server-ip>:9090Replace <your-server-ip> with the IP address or hostname of your Ubuntu server. You should see the Prometheus web interface, where you can explore the available metrics, execute queries, and view the system status.

Common Issues and Troubleshooting
If you encounter any issues during the installation process or while running Prometheus, here are a few common problems and their solutions:
- Prometheus service fails to start: Check the Prometheus logs for any error messages using the command
journalctl -u prometheus. Ensure that the prometheus.yml configuration file is valid and that the specified directories and files have the correct permissions. - Prometheus web UI not accessible: Verify that the Prometheus service is running using the command
sudo systemctl status prometheus. Check if the firewall is allowing traffic on port 9090 and ensure that the server IP or hostname is correct. - No metrics available: Confirm that the scrape targets in the prometheus.yml file are properly configured and accessible. Verify that the exporters or services exposing metrics are running and reachable from the Prometheus server.
Congratulations! You have successfully installed Prometheus. Thanks for using this tutorial for installing the Prometheus monitoring system on Ubuntu 24.04 LTS system. For additional help or useful information, we recommend you check the official Prometheus website.