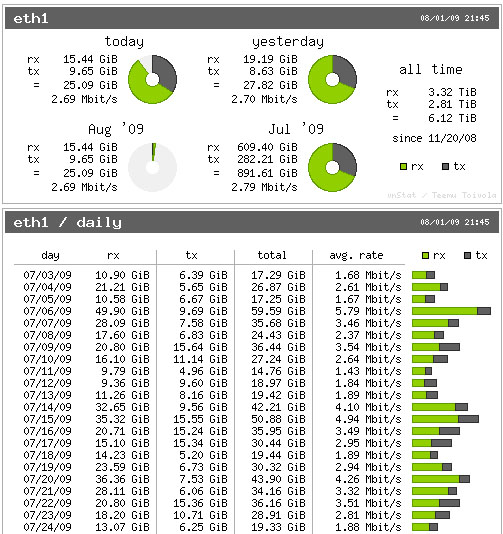
In this tutorial, we will show you how to install and configuration of VnStat Network Monitoring on Ubuntu 16.04 LTS. For those of you who didn’t know, VnStat is a console-based network traffic monitoring tool designed for Linux and BSD. It allows the users to maintain a log of network traffic for the selected interfaces. In this Vnstat tool, the interface bandwidth will reduce automatically.
This article assumes you have at least basic knowledge of Linux, know how to use the shell, and most importantly, you host your site on your own VPS. The installation is quite simple and assumes you are running in the root account, if not you may need to add ‘sudo‘ to the commands to get root privileges. I will show you the step-by-step installation VnStat Network Monitoring on a Ubuntu 16.04 (Xenial Xerus) server.
Prerequisites
- A server running one of the following operating systems: Ubuntu 16.04 (Xenial Xerus).
- It’s recommended that you use a fresh OS install to prevent any potential issues.
- SSH access to the server (or just open Terminal if you’re on a desktop).
- A
non-root sudo useror access to theroot user. We recommend acting as anon-root sudo user, however, as you can harm your system if you’re not careful when acting as the root.
VnStat Features
- Multiple output options.
- Generate png graphic output.
- Consumes lite portion of system resources.
- Monitor multiple network interfaces at the same time.
- Sort the data by month, week, hour, and day.
- Low CPU usage.
Install VnStat Network Monitoring on Ubuntu 16.04 LTS
Step 1. First, make sure that all your system packages are up-to-date by running the following apt-get commands in the terminal.
sudo apt-get update
sudo apt-get upgrade
Step 2. Installing VnStat.
Use apt-get command-line utility to install the vnStat package on your system:
apt-get install vnstat
Once installed, start and enable the Vnstat services:
systemctl start vnstat
systemctl enable vnstat
Step 3. Show Statics using vnStat Command-Line.
Using the vnStat command-line utility you can view statistics on bandwidth per day, per month, and per hour basis. It also provides an option to show statistics in real-time:
### Show Statistics for a day ###
vnstat -d

### Show Statistics for a Month ###
vnstat -m

### Show Statistics for a Hour ###
vnstat -h

### Show Statistics for a Real Time ###
vnstat -l

### For more available options you can use the --help ###
vnstat --help
Step 4. Configure the vnStat PHP Web-Based Interface.
vnStat also provides PHP based web interface to show graphical statistics. In order to set up the vnStat web interface, it is required to install the LAMP stack on Ubuntu 16.04 LTS.
Download vnStat PHP code using the below-given URL.
get http://www.sqweek.com/sqweek/files/vnstat_php_frontend-1.5.1.tar.gz
Extract the downloaded archive in the web-accessible directory, eg: /var/www/html/:
tar xzf vnstat_php_frontend-1.5.1.tar.gz
mv vnstat_php_frontend-1.5.1 /var/www/html/
Edit the config.php file and set the following parameters:
$language = 'en';
$iface_list = array('eth0', 'sixxs');
$iface_title['eth0'] = 'Public Interface';
$vnstat_bin = '/usr/bin/vnstat';
Accessing VnStat via a web browser, open your favorite browser and navigate to http://yourdomain.com/ or http://server-ip-address.

Congratulations! You have successfully installed VnStat. Thanks for using this tutorial for installing the VnStat network monitoring tool on Ubuntu 16.04 LTS (Xenial Xerus) system. For additional help or useful information, we recommend you check the official VnStat website.