Understanding your system’s memory consumption is crucial for maintaining optimal performance on Ubuntu. Whether you’re a system administrator managing servers or an everyday user looking to keep your desktop environment running smoothly, monitoring RAM usage helps you identify performance bottlenecks, troubleshoot issues, and make informed decisions about resource allocation. This comprehensive guide explores various methods for checking RAM usage on Ubuntu, providing both command-line and graphical approaches suitable for users of all experience levels.
Understanding RAM and Memory Types in Ubuntu
Before diving into the specific commands and tools, it’s important to understand the different types of memory metrics in Ubuntu and how they relate to system performance.
Different Memory Types in Ubuntu
Ubuntu, like other Linux systems, categorizes memory in several ways:
- Physical Memory (RAM): The actual hardware memory installed on your system.
- Virtual Memory: Combined space that includes both physical RAM and swap space, allowing your system to handle more processes than would fit in RAM alone.
- Swap Memory: Space on your storage drive used as an extension of RAM when physical memory becomes full.
- Cached Memory: RAM that stores recently accessed file data for quicker retrieval.
- Buffers: Memory used for temporary storage of raw disk blocks, which helps improve I/O operations.
Key Memory Metrics to Understand
When analyzing memory usage, you’ll encounter several important metrics:
- Total Memory: The total amount of RAM installed on your system.
- Used Memory: The amount of RAM currently in use by applications and the system.
- Free Memory: RAM that’s completely unused and immediately available.
- Available Memory: Memory that can be made available for new applications without swapping.
- Shared Memory: Memory that’s shared between multiple processes.
Understanding these different memory types and metrics helps you accurately interpret the information provided by various monitoring tools.
Command-Line Methods for Checking RAM Usage
Linux provides several powerful command-line utilities for checking memory usage. These tools are especially valuable for server management or when working without a graphical environment.
Using the Free Command
The free command is the simplest and most commonly used tool for checking memory usage in Ubuntu.
free -mThe -m flag displays the information in megabytes, making it easier to read. You can also use:
free -h: Shows output in human-readable format (automatically choosing the best unit)free -g: Displays information in gigabytes
The output includes information about total, used, free, shared, buff/cache, and available memory, as well as swap usage.
Example output:
             total        used        free      shared  buff/cache   available
Mem:         16424       966        14938         81        518       15102
Swap:            0          0           0
Using the Top Command
The top command provides real-time information about your system’s resource usage, including memory.
topIn the header section of the output, look for lines beginning with “KiB Mem” and “KiB Swap” to see memory statistics. This command is particularly useful for monitoring which processes are consuming the most memory, as it shows a detailed breakdown of resource usage by process.
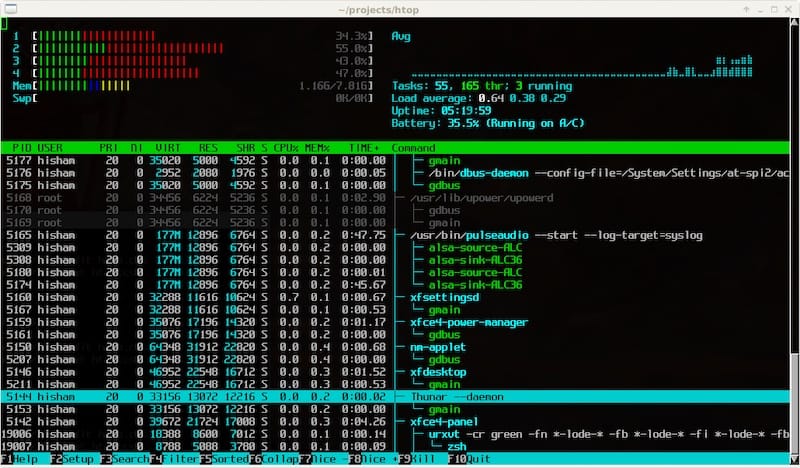
Using the Htop Command
Htop is an enhanced version of top with a more user-friendly interface and additional features.
First, install it if not already present:
sudo apt install htopThen run:
htopHtop provides a colorful, easy-to-read interface that shows memory usage bars at the top of the screen, along with a detailed list of processes and their resource consumption. You can use F1 for help with navigation and additional commands.

Using /proc/meminfo
The /proc/meminfo file contains detailed information about the system’s memory usage.
cat /proc/meminfoThis command displays extensive memory statistics, including:
- MemTotal: Total usable RAM
- MemFree: The amount of physical RAM left unused
- MemAvailable: An estimate of available memory for new applications
- Buffers and Cached: Memory used for system operations
This method provides the most detailed memory information but can be harder to parse visually.
Using the VMStat Command
The vmstat command provides information about system processes, memory, paging, block IO, and CPU activity.
vmstat -sThe -s flag gives you a summary of memory statistics in a clear, list-based format. You can also run vmstat with a time interval to monitor changes over time:
vmstat 2This command will update every 2 seconds, allowing you to track memory usage patterns in real-time.
Using Smem for Proportional Set Size Analysis
Smem is a specialized tool that provides memory usage reports with a focus on “proportional set size” (PSS), offering a more accurate representation of memory used by applications.
To install and use smem:
sudo apt install smem
smem
This tool is particularly useful for advanced users who need detailed information about how memory is shared between processes.
GUI Methods for Checking RAM Usage
For users who prefer graphical interfaces, Ubuntu offers several options to monitor memory usage through GUI applications.
Using the System Monitor
Ubuntu’s built-in System Monitor provides an intuitive way to check memory usage through a graphical interface.
To open System Monitor:
- Press the Super (Windows) key to open the Activities overview
- Type “System Monitor” and click on the application
- Navigate to the “Resources” tab to view memory usage graphs and statistics
The System Monitor displays memory information in an easy-to-understand graphical format, showing total, used, and free memory along with a timeline of usage.
Using Gnome Shell Extensions
Gnome Shell extensions can enhance your desktop environment with persistent memory monitoring capabilities.
To set up memory monitoring in your top bar:
- Install the Gnome Shell Extension Manager:
sudo apt install gnome-shell-extension-manager - Open Extension Manager from the applications menu
- Search for “system-monitor-next” or “Gnome-Stats-Pro” extensions
- Install your preferred extension
- Configure the extension to display memory metrics in your top bar
These extensions provide continuous monitoring without having to open a separate application, allowing you to keep an eye on memory usage while working on other tasks.
Using System Load Indicator
System Load Indicator is a free, open-source application that displays graphical usage of various system resources in the top bar.
To install and use System Load Indicator:
sudo apt install indicator-multiloadOnce installed, launch it from the Applications menu by pressing the Super key, typing “System Load Indicator,” and clicking on the application.
This tool displays memory usage alongside CPU, network, and swap usage in the top bar, providing a comprehensive view of system resources without occupying workspace.
Advanced Memory Monitoring Tools
For users who need more detailed analysis or specialized monitoring capabilities, Ubuntu supports several advanced memory monitoring tools.
Using Glances
Glances is a cross-platform monitoring tool written in Python that provides comprehensive system monitoring, including detailed memory metrics.
To install and use Glances:
sudo apt install glances
glances
Glances offers several advantages:
- Easy-to-use interface with color-coded alerts
- Ability to export metrics to databases like InfluxDB or Elasticsearch
- Cross-platform compatibility for monitoring diverse environments
The tool displays memory usage alongside other system metrics in a single terminal window, making it ideal for quick system checks.
Using Nmon
Nmon (Nigel’s Monitor) is another powerful monitoring tool that provides specialized views for various system resources.
To install and use Nmon:
sudo apt install nmon
nmon
Once running, press ‘m’ to view detailed memory statistics. Nmon provides interactive keyboard commands for different views and can log data for trend analysis, making it valuable for long-term monitoring.
Using dmidecode for Hardware Details
While most tools focus on memory usage, dmidecode provides information about the physical RAM hardware:
sudo dmidecode --type memoryThis command displays detailed information about your RAM modules, including:
- Size and speed of each memory module
- Manufacturer information
- Memory slots usage and capacity
- Maximum supported memory
This information is particularly useful when planning hardware upgrades or troubleshooting potential hardware issues.
Interpreting Memory Results
Understanding the output from memory monitoring tools is crucial for making informed decisions about system performance.
The difference between “free” and “available” memory is significant. Free memory is completely unused, while available memory includes cached data that can be quickly repurposed for applications. This means your system might show low free memory but still have plenty of available memory for new applications.
When evaluating memory usage:
- A consistently high memory usage (>90%) combined with frequent swap activity may indicate you need more RAM
- High cached memory is generally positive, as it improves system performance
- Memory that’s marked as “buffers” helps with I/O operations and file system performance
It’s important to look at memory usage patterns over time rather than single snapshots to get an accurate picture of your system’s needs.
Troubleshooting Common Memory Issues
Even well-configured systems can encounter memory-related problems. Here’s how to identify and address common issues.
Identifying Memory Leaks
Memory leaks occur when applications claim memory but fail to release it after use. Signs of memory leaks include:
- Steadily increasing memory usage over time without additional applications being launched
- Applications becoming slower the longer they run
- System becoming increasingly unresponsive
To identify the culprit:
- Use
toporhtopto sort processes by memory usage - Look for processes that show continuously increasing memory consumption
- Consider restarting problematic applications or updating them to newer versions
Managing High Memory Usage
When faced with high memory consumption:
- Identify memory-intensive processes using
toporhtop - Close unnecessary applications or services
- Consider clearing the cache if needed:
sudo sync; echo 3 | sudo tee /proc/sys/vm/drop_caches - If a specific application is problematic, consider finding alternatives or allocating more resources
For persistent issues, consider increasing your swap space or upgrading your physical RAM.
Recommended Memory Monitoring Practices
Establishing good monitoring habits helps prevent problems before they impact system performance.
- Check memory usage regularly, especially after installing new applications
- Set up automated monitoring for servers or critical systems
- Monitor both memory usage and swap activity for a complete picture
- Track memory trends over time to identify gradual degradation
For servers or critical systems, consider setting up automated monitoring with tools like Glances that can export data to monitoring systems.