In this tutorial, we will show you how to install Grafana on Fedora 35. For those of you who didn’t know, Grafana is multi-platform open-source analytics and interactive visualization web application. Grafana provides charts, graphs, and alerts for the web when connected to supported data sources.
This article assumes you have at least basic knowledge of Linux, know how to use the shell, and most importantly, you host your site on your own VPS. The installation is quite simple and assumes you are running in the root account, if not you may need to add ‘sudo‘ to the commands to get root privileges. I will show you the step-by-step installation of the Grafana open-source platform for visualization and monitoring on a Fedora 35.
Prerequisites
- A server running one of the following operating systems: Fedora 35.
- It’s recommended that you use a fresh OS install to prevent any potential issues.
- SSH access to the server (or just open Terminal if you’re on a desktop).
- A
non-root sudo useror access to theroot user. We recommend acting as anon-root sudo user, however, as you can harm your system if you’re not careful when acting as the root.
Install Grafana on Fedora 35
Step 1. Before proceeding, update your Fedora operating system to make sure all existing packages are up to date. Use this command to update the server packages:
sudo dnf upgrade
sudo dnf update
Step 2. Installing Grafana on Fedora 35.
By default, Grafana is available on Fedora 35 base repository. Then we can install Grafana with the following command below:
sudo dnf install grafana
After installation is complete we need to start the Grafana server to start operating. We do that with the following command:
sudo systemctl start grafana-server
sudo systemctl enable grafana-server
sudo systemctl status grafana-server
Step 3. Configure Firewall.
If you have a running firewalld service, allow port 3000 to access the dashboard from the network:
sudo firewall-cmd --add-port=3000/tcp --permanent
sudo firewall-cmd --reload
Step 4. Accessing Grafana Web interface.
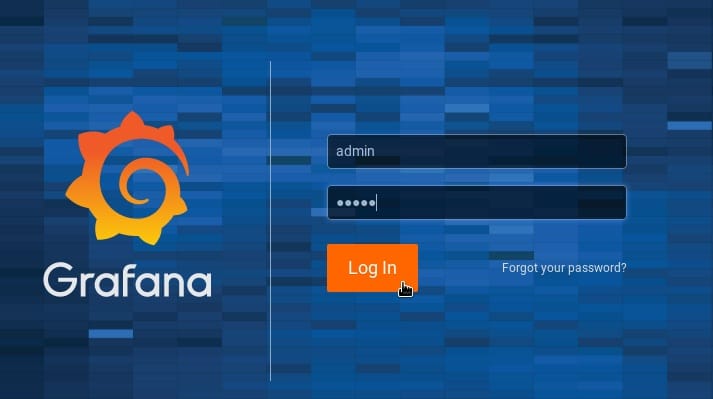
Once successfully installed, open your web browser and access the Grafana using the URL http://your-ip-address:3000. You will be redirected to the Grafana login page. Use the credentials admin for both username and password.

Congratulations! You have successfully installed Grafana. Thanks for using this tutorial for installing Grafana open-source analytics and monitoring on your Fedora 35 system. For additional help or useful information, we recommend you check the official Grafana website.