How To Install Grafana on Fedora 38

In this tutorial, we will show you how to install Grafana on Fedora 38. In today’s data-driven world, the ability to visualize and analyze data effectively is paramount. Grafana, an open-source tool, empowers users to create stunning visualizations and monitor systems with ease.
This article assumes you have at least basic knowledge of Linux, know how to use the shell, and most importantly, you host your site on your own VPS. The installation is quite simple and assumes you are running in the root account, if not you may need to add ‘sudo‘ to the commands to get root privileges. I will show you the step-by-step installation of Grafana on a Fedora 38.
Prerequisites
- A server running one of the following operating systems: Fedora 38.
- It’s recommended that you use a fresh OS install to prevent any potential issues.
- SSH access to the server (or just open Terminal if you’re on a desktop).
- An active internet connection. You’ll need an internet connection to download the necessary packages and dependencies for Grafana.
- A
non-root sudo useror access to theroot user. We recommend acting as anon-root sudo user, however, as you can harm your system if you’re not careful when acting as the root.
Install Grafana on Fedora 38
Step 1. Before we can install Grafana on Fedora 38, it’s important to ensure that our system is up-to-date with the latest packages. This will ensure that we have access to the latest features and bug fixes and that we can install Grafana without any issues:
sudo dnf update
Step 2. Installing Grafana on Fedora 38.
To install Grafana on Fedora 38, you need to add the official Grafana repository. Now import the Grafana repository GPG key by running the following command:
sudo nano /etc/yum.repos.d/grafana.repo
Add the following file:
[grafana]
name=grafana
baseurl=https://rpm.grafana.com
repo_gpgcheck=1
enabled=1
gpgcheck=1
gpgkey=https://rpm.grafana.com/gpg.key
sslverify=1
sslcacert=/etc/pki/tls/certs/ca-bundle.crt
With the repository added, you can now install Grafana on Fedora 38. Follow these steps to complete the installation:
sudo dnf update
sudo dnf install grafana
Confirm the installation by typing “Y” when prompted and wait for the installation process to finish.
After installing Grafana, you need to start the Grafana service to access the web interface. Follow these steps to start the Grafana service:
sudo systemctl enable grafana-server
sudo systemctl start grafana-server
Step 3. Configure Firewall.
Now we open the port in your firewall so you can access Grafana from another device:
sudo firewall-cmd --add-port=3000/tcp --permanent
sudo firewall-cmd --reload
Step 4. Accessing Grafana Web Interface.
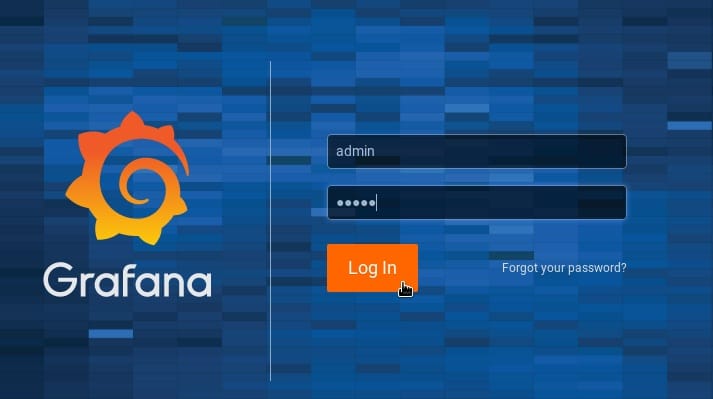
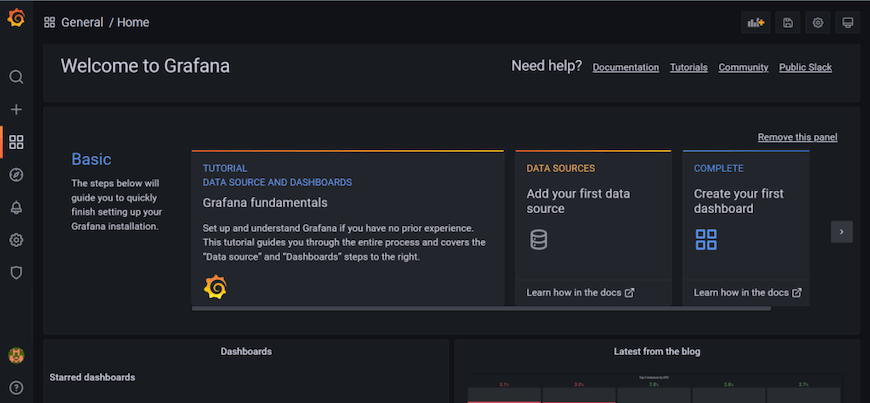
Once installation is successful, you can now access Grafana using the URL http://localhost:3000. You will get the following page:

The Grafana login page will appear. Enter the default username and password:
Username: admin
Password: admin

Step 5. Troubleshooting Tips.
While installing and configuring Grafana, you may encounter some common issues. Here are a few troubleshooting tips to help you overcome them:
Common Installation Issues
- If the Grafana installation fails, ensure that your system meets the necessary requirements, and all dependencies are installed.
- Double-check that the Grafana repository is added correctly to your system’s repository list.
- If you encounter dependency conflicts, try removing conflicting packages or updating your system’s packages before the installation.
Grafana Service Errors
If you experience issues starting the Grafana service, check the service status by running:
sudo systemctl status grafana-server
Review the service logs located in /var/log/grafana for any error messages.
Data Source Configuration Problems
- Verify that the data source configuration details (e.g., URL, port, credentials) are accurate and match the settings of your data provider.
- Check if any firewalls or network restrictions are blocking the communication between Grafana and the data source.
Congratulations! You have successfully installed Grafana. Thanks for using this tutorial for installing Grafana on your Fedora 38 system. For additional help or useful information, we recommend you check the official Grafana website.