In this tutorial, we will show you how to install Grafana on Manjaro. Grafana is a powerful open-source analytics and monitoring solution that is widely used for visualizing time series data. It is particularly popular in the fields of IT operations, security, and IoT.
This article assumes you have at least basic knowledge of Linux, know how to use the shell, and most importantly, you host your site on your own VPS. The installation is quite simple and assumes you are running in the root account, if not you may need to add ‘sudo‘ to the commands to get root privileges. I will show you the step-by-step installation of the Grafana analytics & monitoring database on a Manjaro Linux.
Prerequisites
- A server or desktop running one of the following operating systems: Manjaro, and other Arch-based distributions.
- It’s recommended that you use a fresh OS install to prevent any potential issues.
- SSH access to the server (or just open Terminal if you’re on a desktop).
- A stable internet connection is crucial for downloading and installing packages. Verify your connection before proceeding.
- Access to a Manjaro Linux system with a non-root sudo user or root user.
Install Grafana on Manjaro
Step 1. Keeping your system up-to-date is a fundamental aspect of maintaining a secure and stable operating environment. Before installing any new software, it’s a good practice to update your system packages to the latest versions. In Manjaro, this can be done using the following command:
sudo pacman -Syu
sudo pacman -S base-devel
Step 2. Installing Grafana on Manjaro.
With your system updated, you’re ready to install Grafana. Manjaro’s software repository, a collection of packaged software ready to be installed, includes Grafana. You can install it using the following command:
sudo pamac install grafana
This command tells pamac, Manjaro’s package manager, to install Grafana. The sudo command is used to execute this command with root privileges, which are required for software installation.
To confirm that Grafana has been installed correctly, use the following command:
grafana-server -v
After the installation, you’ll need to start the Grafana service. This can be done using the following command:
sudo systemctl start grafana.service
To ensure Grafana starts automatically when your system boots, you’ll need to enable the service. This can be done with the following command:
sudo systemctl enable grafana.service
Step 3. Configuring Grafana.
Grafana’s configuration file is typically located at /etc/grafana/grafana.ini. This file contains various settings that control Grafana’s behavior. To modify the configuration file, open it using a text editor. For instance, you can use nano:
sudo nano /etc/grafana/grafana.ini
In this file, you can customize settings such as the HTTP port, domain, and data source.
Step 4. Configuring the Firewall.
Uncomplicated Firewall (UFW) and iptables are popular firewall solutions for Linux systems. UFW is a user-friendly front-end for managing iptables firewall rules, while iptables is a powerful tool for network packet filtering.
To install UFW, use the following command:
sudo pacman -S ufw
To enable UFW, use the following command:
sudo ufw enable
Grafana typically runs on port 3000. To allow traffic on this port, use the following command:
sudo ufw allow 3000
To confirm that the firewall is properly configured, use the following command:
sudo ufw status
Step 5. Access Grafana Web UI.
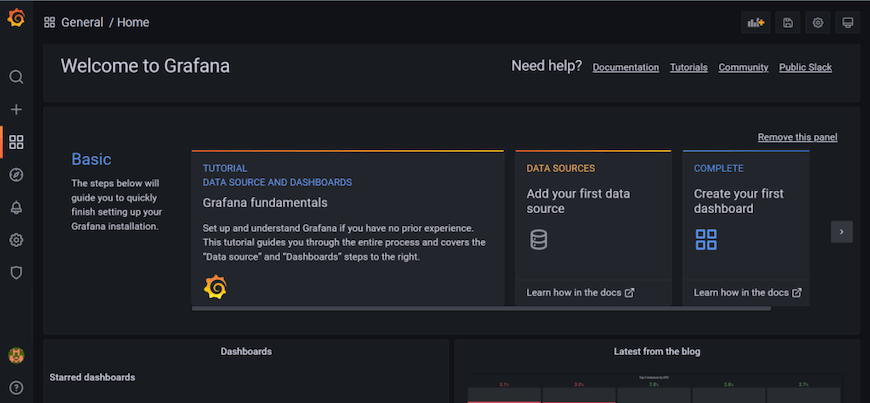
With Grafana installed and running, you’re ready to access the platform. Open a web browser and navigate to http://your-IP-address:3000. The default username and password are both admin. After logging in, you’ll be prompted to change the default password.

Step 4. Troubleshooting Common Issues.
Despite the best preparations, you might encounter some issues during the installation and usage of Grafana. Here are some common problems and their solutions:
- Service not found error: If you encounter an error stating that the
grafana-server.serviceis not found, it’s likely because the service is namedgrafana.servicein Manjaro. Usegrafana.servicewhen starting or enabling the service. - Grafana not starting on boot: If Grafana doesn’t start automatically when your system boots, ensure that you’ve enabled the service using
sudo systemctl enable grafana.service. - Issues with Grafana logs: If you encounter errors or problems, you can check the Grafana server log, usually located at
/var/log/grafana/grafana.log. This log file can provide valuable insights into what might be causing the issue.
Congratulations! You have successfully installed Grafana. Thanks for using this tutorial to install the latest version of the Grafana analytics & monitoring database on the Manjaro system. For additional help or useful information, we recommend you check the official Grafana website.
