How To Install Prometheus on Debian 12

In this tutorial, we will show you how to install Prometheus on Debian 12. In today’s complex digital landscape, system monitoring is paramount. It empowers administrators to proactively identify and mitigate issues before they escalate into critical problems. One of the most powerful and widely adopted tools for this purpose is Prometheus. This open-source monitoring and alerting toolkit is known for its reliability and flexibility.
This article assumes you have at least basic knowledge of Linux, know how to use the shell, and most importantly, you host your site on your own VPS. The installation is quite simple and assumes you are running in the root account, if not you may need to add ‘sudo‘ to the commands to get root privileges. I will show you the step-by-step installation of the Prometheus monitoring tool on a Debian 12 (Bookworm).
Prerequisites
- A server running one of the following operating systems: Debian 12 (Bookworm).
- It’s recommended that you use a fresh OS install to prevent any potential issues.
- SSH access to the server (or just open Terminal if you’re on a desktop).
- An active internet connection. You’ll need an internet connection to download the necessary packages and dependencies for Prometheus.
- A
non-root sudo useror access to theroot user. We recommend acting as anon-root sudo user, however, as you can harm your system if you’re not careful when acting as the root.
Install Prometheus on Debian 12 Bookworm
Step 1. Before we install any software, it’s important to make sure your system is up to date by running the following apt commands in the terminal:
sudo apt update
This command will refresh the repository, allowing you to install the latest versions of software packages.
Step 2. Create a Non-root User for Prometheus.
Running Prometheus as a root user is discouraged for security reasons. It’s best practice to create a dedicated non-root user for Prometheus:
sudo useradd --no-create-home --shell /bin/false prometheus
Step 3. Installing Prometheus on Debian 12.
Prometheus provides pre-compiled binaries that you can download from the official website. First, navigate to your preferred directory for Prometheus installation, such as /opt.
cd /opt
Next, use wget to download the latest version of Prometheus. Make sure to check the official Prometheus download page for the most recent version:
wget https://github.com/prometheus/prometheus/releases/download/v2.47.0/prometheus-2.47.0.linux-amd64.tar.gz
Once the download is complete, extract the Prometheus archive using tar:
sudo tar -xzf prometheus-2.47.0.linux-amd64.tar.gz
Prometheus relies on a configuration file to determine which targets to monitor and how to scrape metrics from them. Let’s create this configuration file:
sudo mkdir -p /etc/prometheus
sudo nano /etc/prometheus/prometheus.yml
Add the following basic configuration to prometheus.yml:
global:
  scrape_interval: 15s

scrape_configs:
  - job_name: 'prometheus'
    static_configs:
      - targets: ['localhost:9090']
This minimal configuration instructs Prometheus to scrape its own metrics. We will explore more advanced configurations later.
Step 4. Create Prometheus Systemd Service.
Create a new systemd unit file for Prometheus:
sudo nano /etc/systemd/system/prometheus.service
Add the following content to the unit file:
[Unit]
Description=Prometheus Monitoring
Wants=network-online.target
After=network-online.target

[Service]
User=prometheus
ExecStart=/opt/prometheus-2.47.0.linux-amd64/prometheus \
  --config.file=/etc/prometheus/prometheus.yml \
  --storage.tsdb.path=/var/lib/prometheus/ \
  --web.console.templates=/opt/prometheus-2.47.0.linux-amd64/consoles \
  --web.console.libraries=/opt/prometheus-2.47.0.linux-amd64/console_libraries

[Install]
WantedBy=multi-user.target
Reload systemd to apply the changes and start Prometheus:
sudo systemctl daemon-reload
sudo systemctl start prometheus
sudo systemctl enable prometheus
You can check the status of the Prometheus service to ensure it’s running without issues:
sudo systemctl status prometheus
Step 5. Configure Firewall.
Now we set up an Uncomplicated Firewall (UFW) with Prometheus to allow public access on default web ports 9090:
sudo ufw allow OpenSSH
sudo ufw allow 9090/tcp
sudo ufw enable
Step 6. Accessing Prometheus Web UI.
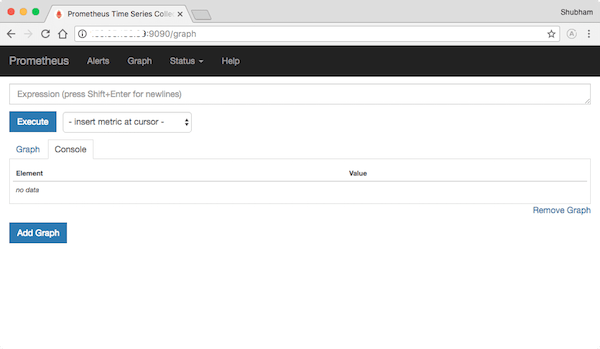
By default, Prometheus’s web interface is accessible locally at http://localhost:9090. To make it accessible from your web browser, you’ll need to configure a reverse proxy or open the port in your firewall. For security reasons, consider using a reverse proxy with HTTPS.

Step 7. Troubleshooting.
A. Common Installation and Configuration Issues √
- Service Not Starting: Check the
systemdlogs for errors and ensure file paths in unit files are correct. - Configuration Errors: Validate your
prometheus.ymlfor syntax errors. - Firewall Blocking: Ensure firewall rules permit incoming connections to Prometheus and exporters.
B. Using Prometheus Logs for Troubleshooting √
Prometheus logs valuable information that can help diagnose issues. Check the logs using the following command:
journalctl -u prometheus
Congratulations! You have successfully installed Prometheus. Thanks for using this tutorial to install the latest version of the Prometheus monitoring tool on Debian 12 Bookworm. For additional help or useful information, we recommend you check the official Prometheus website.