In this tutorial, we will show you how to install Prometheus on Ubuntu 22.04 LTS. For those of you who didn’t know, Prometheus is a powerful and flexible monitoring solution that is well-suited for modern cloud-native applications and infrastructure. Its simplicity and ease of use make it a popular choice for organizations of all sizes, and its scalability and reliability ensure that it can meet the demands of even the largest and most complex environments.
This article assumes you have at least basic knowledge of Linux, know how to use the shell, and most importantly, you host your site on your own VPS. The installation is quite simple and assumes you are running in the root account, if not you may need to add ‘sudo‘ to the commands to get root privileges. I will show you the step-by-step installation of the Prometheus open-source monitoring system on Ubuntu 22.04 (Jammy Jellyfish). You can follow the same instructions for Ubuntu 22.04 and any other Debian-based distribution like Linux Mint, Elementary OS, Pop!_OS, and more as well.
Prerequisites
- A server running one of the following operating systems: Ubuntu 22.04, 20.04, and any other Debian-based distribution like Linux Mint.
- It’s recommended that you use a fresh OS install to prevent any potential issues.
- SSH access to the server (or just open Terminal if you’re on a desktop).
- An active internet connection. You’ll need an internet connection to download the necessary packages and dependencies for Prometheus.
- A
non-root sudo useror access to theroot user. We recommend acting as anon-root sudo user, however, as you can harm your system if you’re not careful when acting as the root.
Install Prometheus on Ubuntu 22.04 LTS Jammy Jellyfish
Step 1. First, make sure that all your system packages are up-to-date by running the following apt commands in the terminal.
sudo apt update
sudo apt upgrade
sudo apt install dirmngr gnupg apt-transport-https ca-certificates software-properties-common
Step 2. Create System User for Prometheus.
Now we create a user and a group for the Prometheus system:
sudo groupadd --system prometheus
sudo useradd -s /sbin/nologin --system -g prometheus prometheus
Step 3. Create Prometheus Directory.
You need to create the directory required to run Prometheus, run the following commands to create:
sudo mkdir /etc/prometheus
sudo mkdir /var/lib/prometheus
Step 4. Installing Prometheus on Ubuntu 22.04.
By default, Prometheus is not available on Ubuntu 22.04 base repository. Now run the following command below to download the latest version of Prometheus from the GitHub page to your Ubuntu system:
wget https://github.com/prometheus/prometheus/releases/download/v2.42.0/prometheus-2.42.0.linux-amd64.tar.gz
Next, extract the Prometheus tar file:
tar vxf prometheus*.tar.gz
Now navigate to the directory and move the Prometheus required directory using the following command:
cd prometheus*/
sudo mv prometheus promtool /usr/local/bin/
To verify the installed version of Prometheus on Ubuntu 22.04, execute the following command below:
prometheus --version
Step 5. Configuring Prometheus.
Once you have installed Prometheus, you will need to configure it to suit your needs. The configuration file for Prometheus is located at /etc/prometheus/prometheus.yml. The configuration file contains a number of settings that you can adjust to suit your needs, including the targets that Prometheus should scrape for metrics, the data retention period, and the alerting rules:
mv prometheus.yml /etc/prometheus/prometheus.yml
mv consoles/ console_libraries/ /etc/prometheus/
Step 6. Create Prometheus Systemd Service.
Now create a prometheus.service file to control the Prometheus daemon by executing the following command:
nano /etc/systemd/system/prometheus.service
Add the following file:
[Unit]
Description=Prometheus
Documentation=https://prometheus.io/docs/introduction/overview/
Wants=network-online.target
After=network-online.target
[Service]
User=prometheus
Group=prometheus
Type=simple
ExecStart=/usr/local/bin/prometheus \
--config.file /etc/prometheus/prometheus.yml \
--storage.tsdb.path /var/lib/prometheus/ \
--web.console.templates=/etc/prometheus/consoles \
--web.console.libraries=/etc/prometheus/console_libraries

[Install]
WantedBy=multi-user.target
Save and close the file, then reload and enable the Prometheus daemon:
sudo systemctl daemon-reload
sudo systemctl enable --now prometheus
Step 7. Configure Firewall.
Now we set up an Uncomplicated Firewall (UFW) with Prometheus to allow public access on default web ports 9090:
sudo ufw allow OpenSSH
sudo ufw allow 9090/tcp
sudo ufw enable
Step 8. Accessing Prometheus Web Interface.
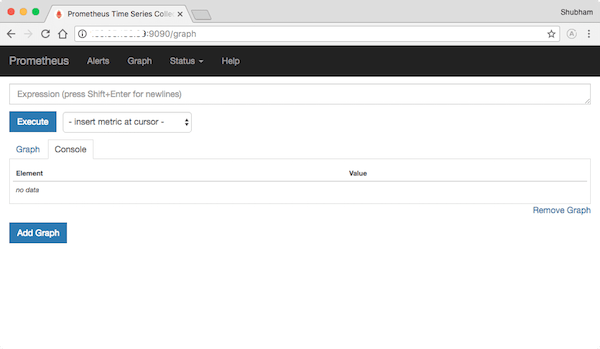
Once successfully installed, open your web browser and access the Prometheus Web UI using the URL http://your-IP-address:9090. You will be redirected to the following page:

Congratulations! You have successfully installed Prometheus. Thanks for using this tutorial for installing the Prometheus monitoring system on Ubuntu 22.04 LTS Jammy Jellyfish system. For additional help or useful information, we recommend you check the official Prometheus website.

