![]()
In this tutorial, we will show you how to install Prometheus on Manjaro. Prometheus is a feature-rich monitoring system that offers a wide array of benefits, such as real-time data collection, alerting capabilities, and a user-friendly web-based dashboard.
This article assumes you have at least basic knowledge of Linux, know how to use the shell, and most importantly, you host your site on your own VPS. The installation is quite simple and assumes you are running in the root account, if not you may need to add ‘sudo‘ to the commands to get root privileges. I will show you the step-by-step installation of the Prometheus monitoring system on a Manjaro Linux.
Prerequisites
- A server or desktop running one of the following operating systems: Manjaro, and other Arch-based distributions.
- It’s recommended that you use a fresh OS install to prevent any potential issues.
- SSH access to the server (or just open Terminal if you’re on a desktop).
- Ensure that your Manjaro system is connected to the internet. This is crucial as it allows you to download the required packages and the Prometheus installation.
- A
non-root sudo useror access to theroot user. We recommend acting as anon-root sudo user, however, as you can harm your system if you’re not careful when acting as the root.
Install Prometheus on Manjaro
Step 1. Before diving into the Prometheus installation, it’s crucial to make sure your Manjaro system is up to date. Open a terminal and execute the following commands:
sudo pacman -Syu
sudo pacman -S git base-devel
Step 2. Installing Prometheus on Manjaro.
To install Prometheus, we’ll download the Prometheus binary, create a dedicated user and group for Prometheus, set up the configuration, and run Prometheus as a systemd service.
- Method 1: Manually Downloading and Installing the Binary.
Now visit the Prometheus download page and get the latest release URL. At the time of writing, the latest version is 2.47.2, but you should use the most recent version available.
wget https://github.com/prometheus/prometheus/releases/download/v2.47.2/prometheus-2.47.2.linux-amd64.tar.gz
Move the prometheus binary to /usr/local/bin by running the following command:
sudo mv prometheus-2.47.2.linux-amd64/prometheus /usr/local/bin/
Create a new user for Prometheus by running the following command:
sudo useradd --no-create-home --shell /bin/false prometheus
Create a new directory for the Prometheus data by running the following command:
sudo mkdir /var/lib/prometheus
Change the ownership of the /var/lib/prometheus directory to the prometheus user by running the following command:
sudo chown prometheus:prometheus /var/lib/prometheus
Create a new directory for the Prometheus configuration file by running the following command:
sudo mkdir /etc/prometheus
Move the prometheus.yml configuration file to the /etc/prometheus directory by running the following command:
sudo mv prometheus-2.47.2.linux-amd64/prometheus.yml /etc/prometheus/
Change the ownership of the /etc/prometheus directory to the prometheus user by running the following command:
sudo chown prometheus:prometheus /etc/prometheus
Create a new systemd service file for Prometheus by running the following command:
sudo nano /etc/systemd/system/prometheus.service
Paste the following contents into the file:
[Unit]
Description=Prometheus
Wants=network-online.target
After=network-online.target

[Service]
User=prometheus
Group=prometheus
Type=simple
ExecStart=/usr/local/bin/prometheus \
    --config.file /etc/prometheus/prometheus.yml \
    --storage.tsdb.path /var/lib/prometheus \
    --web.console.templates=/usr/local/bin/consoles \
    --web.console.libraries=/usr/local/bin/console_libraries
Restart=always

[Install]
WantedBy=multi-user.target
Save and close the file then, start the Prometheus service by running the following command:
sudo systemctl daemon-reload
sudo systemctl start prometheus
- Method 2: Using the Package Manager.
Install Prometheus by running the following command:
sudo pacman -S prometheus
Verify that Prometheus is installed by running the following command:
prometheus --version
After installing Prometheus, start the Prometheus service and enable it to start at system reboot:
sudo systemctl start prometheus
sudo systemctl start prometheus
Step 3. Firewall Configuration.
If you have a firewall enabled, make sure to allow incoming traffic on port 9090, which is the default port for Prometheus:
sudo ufw allow 9090/tcp
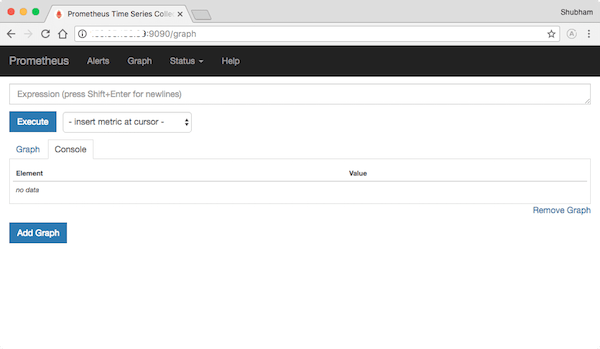
Step 4. Accessing Prometheus Web UI.
Now you can access the Prometheus Web UI from a web browser on your local network by entering your server’s IP address, followed by port 9090:
http://your_server_ip:9090
Congratulations! You have successfully installed Prometheus. Thanks for using this tutorial to install the latest version of the Prometheus monitoring system on the Manjaro system. For additional help or useful information, we recommend you check the official Prometheus website.
[su_box title=”VPS Manage Service Offer” style=”bubbles” box_color=”#000000″ radius=”10″]If you don’t have time to do all of this stuff, or if this is not your area of expertise, we offer a service to do “VPS Manage Service Offer”, starting from $10 (Paypal payment). Please contact us to get the best deal![/su_box]