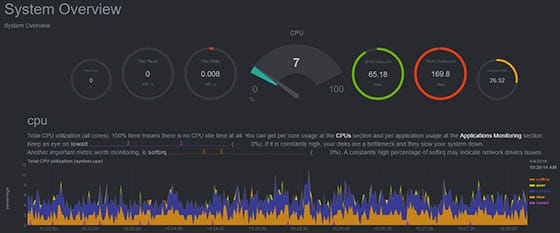
In this tutorial, we will show you how to install Netdata Monitoring on CentOS 7. For those of you who didn’t know, Netdata is a real-time performance, troubleshooting, and health Monitoring tool for Applications and Systems. Netdata is a free and open-source tool that supports Linux, FreeBSD, and macOS systems which is helpful for SysAdmins, DevOps, and Developers for troubleshooting real-time issues. With Netdata, you can monitor CPU, RAM usage, disk I/O, network traffic, and Postfix, among many others.
This article assumes you have at least basic knowledge of Linux, know how to use the shell, and most importantly, you host your site on your own VPS. The installation is quite simple and assumes you are running in the root account, if not you may need to add ‘sudo‘ to the commands to get root privileges. I will show you the step-by-step installation Netdata performance monitoring tool on a CentOS 7 server.
Netdata features
- Monitors and renders various system metrics in real-time, such as CPU, memory, disk I/O, network traffic, system processes, Apache/Nginx status, MySQL status, Postfix message queue, and others.
- Runs on most Linux distributions.
- Is highly optimized to use minimal CPU, memory, and disk I/O.
- Provide stunning real-time metrics graphics in an intuitive web interface.
Prerequisites
- A server running one of the following operating systems: CentOS 7.
- It’s recommended that you use a fresh OS install to prevent any potential issues.
- SSH access to the server (or just open Terminal if you’re on a desktop).
- A
non-root sudo useror access to theroot user. We recommend acting as anon-root sudo user, however, as you can harm your system if you’re not careful when acting as the root.
Install Netdata Monitoring on CentOS 7
Step 1. First, let’s start by ensuring your system is up-to-date.
yum clean all
yum -y update
Step 2. Installing Netdata Monitoring on CentOS 7.
Install the following dependency before installing Netdata:
yum install libuuid-devel zlib-devel gcc make git autoconf autogen automake pkgconfig psmisc
Run the following command to clone the Netdata git and execute “netdata-installer.sh” script to install Netdata:
git clone https://github.com/firehol/netdata.git --depth=1
cd netdata
sudo ./netdata-installer.sh -y
Following the installation instruction shown on your screen, You would get an interactive prompt for installing Netdata:
Welcome to netdata!
Nice to see you are giving it a try!

You are about to build and install netdata to your system.

It will be installed at these locations:

 - the daemon   at /usr/sbin/netdata
 - config files at /etc/netdata
 - web files    at /usr/share/netdata
 - plugins      at /usr/libexec/netdata
 - cache files  at /var/cache/netdata
 - log files    at /var/log/netdata
 - pid file     at /var/run

This installer allows you to change the installation path.
Press Control-C and run the same command with --help for help.

Press ENTER to build and install netdata to your system >
Step 3. Configure Firewall for Netdata.
Before you can access Netdata’s web interface, you need to modify firewall rules to allow traffic on port 19999, the default communication port of Netdata:
firewall-cmd --permanent --zone=public --add-port=19999/tcp
firewall-cmd --reload
Step 4. Accessing Netdata.
Netdata will be available on HTTP port 19999 by default. Open your favorite browser and navigate to http://your-domain.com:19999 or http://your-server-ip:19999

Congratulations! You have successfully installed Netdata. Thanks for using this tutorial for installing Netdata’s real-time performance monitoring tool on CentOS 7 system. For additional help or useful information, we recommend you to check the official Netdata website.