In this tutorial, we will show you how to install Darkstat on Debian 12. In today’s digital landscape, network traffic monitoring is not just a best practice; it’s a necessity. Whether you are a system administrator responsible for maintaining a server infrastructure or a network engineer overseeing a complex network, having real-time insights into your network’s traffic patterns is crucial. This is where Darkstat Network Traffic Analyzer comes into play. Darkstat is a lightweight and efficient tool that enables you to monitor and analyze network traffic on your Debian 12 system with ease.
This article assumes you have at least basic knowledge of Linux, know how to use the shell, and most importantly, you host your site on your own VPS. The installation is quite simple and assumes you are running in the root account, if not you may need to add ‘sudo‘ to the commands to get root privileges. I will show you the step-by-step installation of the Darkstat Network Traffic Analyzer on a Debian 12 (Bookworm).
Prerequisites
- A server running one of the following operating systems: Debian 12 (Bookworm).
- It’s recommended that you use a fresh OS install to prevent any potential issues.
- SSH access to the server (or just open Terminal if you’re on a desktop).
- An active internet connection. You’ll need an internet connection to download the necessary packages and dependencies for Darkstat.
- A
non-root sudo useror access to theroot user. We recommend acting as anon-root sudo user, however, as you can harm your system if you’re not careful when acting as the root.
Install Darkstat on Debian 12 Bookworm
Step 1. Before we install any software, it’s important to make sure your system is up to date by running the following apt commands in the terminal:
sudo apt update
This command will refresh the repository, allowing you to install the latest versions of software packages.
Step 2. Installing Necessary Dependencies.
Darkstat relies on a few dependencies to compile successfully. To install these dependencies, use the following command:
sudo apt install build-essential libpcap-dev zlib1g-dev
Step 3. Installing Darkstat on Debian 12.
- Method 1: Using apt package manager
Install Darkstat by running the following command:
sudo apt install darkstat
Once the installation is complete, you can start Darkstat by running the following command:
sudo systemctl start darkstat
- Method 2: Building from the source
We need to obtain the Darkstat source code to build and install it. You can download it directly to your server using wget:
wget http://unix4lyfe.org/darkstat/darkstat-3.0.719.tar.bz2
After downloading the source code, extract it using the following command:
tar -xvjf darkstat-3.0.719.tar.bz2
Navigate to the Darkstat source code directory and compile it:
cd darkstat-3.0.719
make
sudo make install
Step 4. Configuring Darkstat.
Now that we have Darkstat installed, it’s time to configure it to suit your specific needs. Darkstat relies on a configuration file to specify various settings. Let’s create a configuration file and make it your own:
sudo cp /usr/local/etc/darkstat.conf /etc/darkstat.conf
Next, open the configuration file with your preferred text editor:
sudo nano /etc/darkstat.conf
Within this file, you can customize Darkstat’s behavior to fit your requirements. Some essential configuration options include:
INTERFACE: Specify the network interface to monitor, e.g.,-i eth0.BINDIP: Set the IP address for the web interface.PORT: Choose the port for Darkstat’s web interface (default is 667).OUTFILE: Define the location of the output file.LOGFILE: Specify where Darkstat logs its activities.
Take your time to review and adjust these settings according to your preferences.
Step 5. Starting Darkstat.
To begin monitoring your network traffic with Darkstat, start the Darkstat service using the following command:
sudo darkstat -i INTERFACE -c /etc/darkstat.conf
Remember to replace INTERFACE with the network interface you wish to monitor.
Step 6. Verifying Darkstat’s Status.
After initiating the Darkstat service, you can verify its status to ensure everything is working correctly. Access Darkstat’s web interface by opening a web browser and entering the following URL:
http://your_server_ip:667
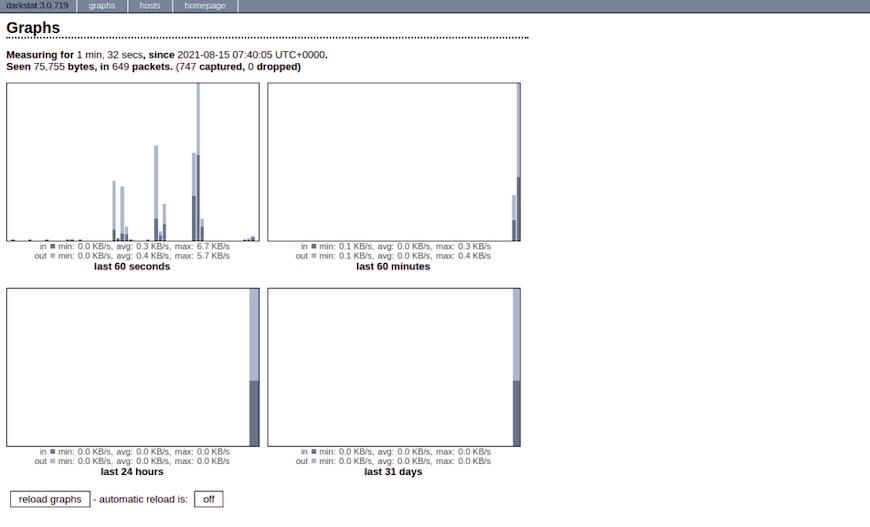
By default, Darkstat’s web interface runs on port 667. Replace your_server_ip with your server’s IP address. You should see Darkstat’s dashboard displaying real-time network traffic data.

Congratulations! You have successfully installed Darkstat. Thanks for using this tutorial to install the latest version of Darkstat Network Traffic Analyzer on Debian 12 Bookworm. For additional help or useful information, we recommend you check the official Darkstat website.
