
Most Linux servers fail silently. A disk fills up, memory leaks, or a service crashes, and nobody notices until users start complaining. That’s the problem monitoring solves, and Prometheus is one of the most trusted open-source tools for the job.
If you’re running a fresh Fedora 44 box and want real visibility into CPU, memory, and service health, you’re in the right place. This guide walks through a complete Prometheus Fedora 44 setup, from a clean install to a secured, self-healing systemd service.
Fedora 44 launched in late April 2026 with an updated kernel and systemd stack, which makes it a solid platform for a modern monitoring server. The current stable release is Prometheus 3.13.0 LTS, which is the version this tutorial installs.
By the end, you’ll have Prometheus running, firewalled correctly, and pulling real metrics from your host. Let’s get started with how to install Prometheus on Fedora 44.
What Is Prometheus and Why Use It
Prometheus is an open-source monitoring and alerting toolkit that pulls metrics from your systems on a schedule. Unlike older tools that wait for agents to push data to them, Prometheus reaches out and scrapes metrics itself.
This pull-based model matters for a few reasons:
- It’s easier to debug because you control the scrape schedule from one place.
- It works well with dynamic environments like containers and cloud servers.
- It stores everything as time-series data, so you can query trends over weeks or months.
Prometheus was built at SoundCloud and is now a graduated project under the Cloud Native Computing Foundation. That backing is part of why it has become a default choice for teams that need reliable, long-term server monitoring.
Why Fedora 44 Is a Good Fit for This Setup
Fedora 44 ships with a newer kernel, updated systemd, and stricter default firewalld rules than older releases. That combination is good for security, but it also means a few extra steps compared to older tutorials you might find online.
One key detail: Fedora’s official package repos often lag behind the latest Prometheus release. Because of that, this guide installs Prometheus manually from the official binary rather than through dnf. This gives you the newest features and lets you control exactly which version runs on your server.
Prerequisites
Before you start, make sure you have the following ready:
- A server running Fedora 44 with root or sudo access
- At least 2GB of RAM and 10GB of free disk space
- An active internet connection to download the Prometheus binary
- Basic comfort editing text files in the terminal
firewalldenabled (default on Fedora 44)
RAM and disk space matter here because Prometheus keeps all scraped data in a local time-series database. The more targets you monitor and the longer you keep the data, the more disk space you’ll need over time.
Step 1: Update Your System
Always start with a clean, updated system. This avoids random dependency conflicts later.
sudo dnf update -yWhat this does: it refreshes your package list and installs the latest security patches and library updates.
Why it matters: Prometheus depends on system libraries like glibc and systemd. Running an outdated system increases the chance of weird errors that have nothing to do with Prometheus itself, but everything to do with old packages underneath it.
If the update installs a new kernel, reboot before continuing:
sudo rebootExpected Output
Complete!That confirms the update finished cleanly.
Step 2: Install Required Tools
Next, install a handful of small utilities you’ll need for the rest of this tutorial.
sudo dnf install curl wget tar nano -yWhat this does: installs wget and curl for downloading files, tar for extracting archives, and nano for editing config files.
Why it matters: Prometheus ships as a .tar.gz archive on GitHub, not as an RPM package in most cases. Without tar, you can’t unpack it. Without wget or curl, you can’t pull it down in the first place.
Step 3: Create a Dedicated Prometheus User
Never run a monitoring service as root. Create a separate system account instead.
sudo useradd --no-create-home --shell /bin/false prometheusWhat this does: creates a user named prometheus with no home directory and no login shell.
Why it matters: this follows the principle of least privilege. If someone were ever able to exploit the Prometheus process, they would be stuck with a locked-down account instead of full server access. This is a basic but important security habit for any sysadmin.
Step 4: Download and Verify Prometheus
Now download the actual Prometheus binary from the official GitHub releases page.
cd /tmp
wget https://github.com/prometheus/prometheus/releases/download/v3.13.0/prometheus-3.13.0.linux-amd64.tar.gz
What this does: downloads the compressed Prometheus release to a temporary folder.
Why it matters: using /tmp keeps your working files separate from the final install location. This makes cleanup simple and avoids clutter in system directories.
Extract the archive:
tar -xvf prometheus-3.13.0.linux-amd64.tar.gzSub-step: Verify the Download
Check the checksum before trusting the file:
sha256sum prometheus-3.13.0.linux-amd64.tar.gzWhy this matters: comparing this output against the checksum published on the official Prometheus download page confirms the file wasn’t corrupted or tampered with during download. This step is small but it’s a trust-building habit worth keeping for any binary you download from the internet.
Step 5: Set Up Directories and Permissions
Prometheus needs dedicated folders for its config files and its data.
sudo mkdir -p /etc/prometheus /var/lib/prometheusWhat this does: creates one folder for configuration and one for stored metrics data.
Why it matters: separating config from data follows standard Linux folder conventions. It also makes backups simpler, since you can back up /etc/prometheus separately from the much larger /var/lib/prometheus data folder.
Set correct ownership:
sudo chown prometheus:prometheus /etc/prometheus /var/lib/prometheusWhy it matters: if the prometheus user doesn’t own these folders, the service will fail to start with permission errors the moment it tries to write data.
Step 6: Install the Binaries
Move into the extracted folder and copy the files into place.
cd prometheus-3.13.0.linux-amd64
sudo cp prometheus promtool /usr/local/bin/
sudo cp -r consoles console_libraries /etc/prometheus/
What this does: places the main prometheus binary, the promtool config checker, and the web UI assets into their final locations.
Why it matters: /usr/local/bin is the standard spot for software installed outside of dnf. Keeping it separate from system-managed binaries avoids conflicts if you ever install a packaged version later.
Fix ownership on the copied files:
sudo chown -R prometheus:prometheus /etc/prometheus/consoles /etc/prometheus/console_librariesStep 7: Configure Prometheus
Create the main config file.
sudo nano /etc/prometheus/prometheus.ymlPaste this basic configuration:
global:
  scrape_interval: 15s
  evaluation_interval: 15s

scrape_configs:
  - job_name: 'prometheus'
    static_configs:
      - targets: ['localhost:9090']
What this does: tells Prometheus how often to collect metrics and where to collect them from. Right now, it’s just watching itself.
Why it matters: the scrape_interval controls a trade-off. A shorter interval gives you more detailed data but uses more CPU and disk. Fifteen seconds is a safe default for most small to mid-size setups.
One warning from experience: YAML is picky about spacing. A single misplaced space can stop Prometheus from starting, and the error message won’t always point you in the right direction. Double-check your indentation before moving on.
Save ownership on the file:
sudo chown prometheus:prometheus /etc/prometheus/prometheus.ymlStep 8: Check Your Configuration
Before starting anything, validate the config file.
/usr/local/bin/promtool check config /etc/prometheus/prometheus.ymlWhat this does: runs the same internal checker Prometheus uses to catch syntax errors.
Why it matters: catching a bad config here takes seconds. Catching it after the service fails to start means digging through logs instead.
Expected Output
SUCCESS: /etc/prometheus/prometheus.yml is valid prometheus config file syntaxIf you see this line, you’re clear to move on.
Step 9: Create a systemd Service
Running Prometheus manually is fine for testing, but you want it to survive reboots. Create a systemd unit file.
sudo nano /etc/systemd/system/prometheus.serviceAdd the following:
[Unit]
Description=Prometheus Monitoring System
Wants=network-online.target
After=network-online.target

[Service]
User=prometheus
Group=prometheus
Type=simple
Restart=on-failure
RestartSec=5s
ExecStart=/usr/local/bin/prometheus \
  --config.file=/etc/prometheus/prometheus.yml \
  --storage.tsdb.path=/var/lib/prometheus/ \
  --web.console.templates=/etc/prometheus/consoles \
  --web.console.libraries=/etc/prometheus/console_libraries \
  --web.listen-address=0.0.0.0:9090 \
  --storage.tsdb.retention.time=15d

[Install]
WantedBy=multi-user.target
What this does: tells systemd how to start, restart, and manage Prometheus like any other Linux service.
Why it matters: Restart=on-failure means Prometheus will automatically come back up if it crashes, without you needing to log in and fix it manually. The retention.time flag also matters a lot for capacity planning. Fifteen days is a reasonable starting point that keeps disk usage predictable.
Step 10: Start and Enable the Service
Reload systemd so it recognizes the new file, then start Prometheus.
sudo systemctl daemon-reload
sudo systemctl enable --now prometheus
What this does: the first command refreshes systemd’s cache of service files. The second one starts Prometheus immediately and sets it to launch on every boot.
Why it matters: skipping daemon-reload is one of the most common reasons a brand-new service file seems to “not exist” when you try to start it. It’s a small step, but it trips up a lot of people.
Check that it’s running:
sudo systemctl status prometheusExpected Output
You should see:
Active: active (running)If you see this, your Prometheus Fedora 44 setup is live.
Step 11: Open the Firewall
Fedora 44 runs firewalld by default, which blocks external access to port 9090 out of the box.
sudo firewall-cmd --permanent --add-port=9090/tcp
sudo firewall-cmd --reload
What this does: opens port 9090 so you can reach the Prometheus web interface from another machine.
Why it matters: without this step, Prometheus will run fine locally but you won’t be able to load the dashboard from your laptop or workstation. This trips up a lot of first-time installs.
If this server is public-facing, consider limiting access to a specific IP range instead of opening the port to everyone:
sudo firewall-cmd --permanent --zone=public --add-rich-rule='rule family="ipv4" source address="YOUR_IP/32" port protocol="tcp" port="9090" accept'Step 12: Access the Web Interface
Open a browser and visit:
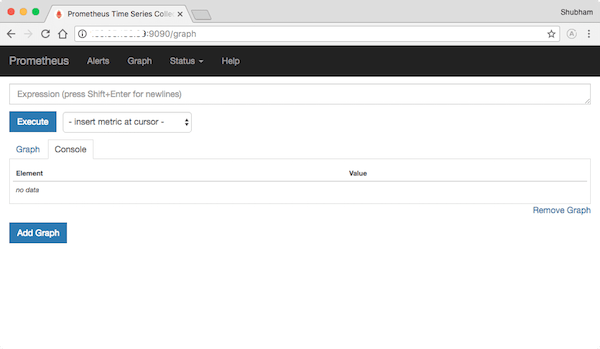
http://your-server-ip:9090Go to Status > Targets to confirm Prometheus is scraping itself. Then run a quick test query:
upWhy this matters: the up metric is the fastest way to confirm the whole pipeline works, from config file to scrape to storage to query. A value of 1 means everything is healthy.
Configure Prometheus Fedora 44 With Node Exporter
Right now, Prometheus only monitors itself. To get real system metrics like CPU and memory, add Node Exporter.
cd /tmp
wget https://github.com/prometheus/node_exporter/releases/download/v1.9.0/node_exporter-1.9.0.linux-amd64.tar.gz
tar -xvf node_exporter-1.9.0.linux-amd64.tar.gz
sudo cp node_exporter-1.9.0.linux-amd64/node_exporter /usr/local/bin/
Create a matching system user and systemd service, following the same pattern as Prometheus itself, then open port 9100 in firewalld.
Add a new job to prometheus.yml:
  - job_name: 'node'
    static_configs:
      - targets: ['localhost:9100']
Restart Prometheus to pick up the change:
sudo systemctl restart prometheusWhy it matters: Node Exporter is what turns Prometheus from “a tool watching itself” into “a tool watching your actual server.” This is usually the very next step after any fresh install.
Troubleshooting Common Issues
Even a clean install can hit a snag. Here are the issues that come up most often.
Service fails to start. Check the logs first.
sudo journalctl -u prometheus -fThis almost always points to a config error or a permissions problem.
“Permission denied” errors. Double-check ownership on your directories.
sudo chown -R prometheus:prometheus /var/lib/prometheus /etc/prometheusYAML config errors. Run promtool check config again. Nine times out of ten, this is a spacing or indentation mistake.
Port 9090 already in use. Find what’s using it.
sudo lsof -i :9090Either stop the other process or change Prometheus’s listen address in the service file.
Targets show as “down” in the web UI. This usually means firewalld is blocking the connection, or the target service isn’t actually running. Check both before assuming Prometheus is broken.